CIO Office

3Q26 Review
Mid-Term Uncertainty
The third quarter provided a textbook illustration of how market psychology swings between optimism and anxiety. While equity indexes appeared serene on the surface, significant internal rotation lay beneath. More tellingly, bond market volatility surged—with the MOVE index rising from the 70s to 107—and 30-year U.S. Treasury yields rallied over 80bps to 5.733%, levels unseen since 2002. This sharp repricing reflects a growing skepticism regarding fiscal management under Treasury Secretary Bessent. As a result, credit spreads in non-investment grade widened, particularly in B and CCC, as credit investors moved to safety in investment-grade credit.
Recent U.S. inflation and labor indicators have been noisy, yet a deeper look at the data reveals a clearer underlying signal: inflation pressures are trending higher. As supply chain frictions filter into manufactured goods globally, China's PPI reached 5.0% after trending steadily upward over the past year. While consensus previously pointed to China as a source of disinflation, market participants may soon have to consider whether it becomes a driver of imported price pressures instead.
In contrast to prevailing market sentiment, China’s corporate results had been improving. Many historically low-margin businesses have expanded gross margins to 30%–50%, delivered healthy net margins, and generated strong free cash flow margins of 20%–30% over the past year, culminating in 2Q earnings growth of 25.7%. This is largely due to improvements in technology and innovation and the ability to produce at scale. While household savings continue to grow, consumer behavior reflects cautious selectivity: travel volume has risen, but spending per head remains restrained as households choose cost-effective options like rail over driving in response to high energy prices.
Europe continues to face a more challenging structural setup, burdened by high energy costs, sticky inflation, and social unrest following an uncomfortably hot summer.
With mid-term elections approaching, the range of potential political, geopolitical, and economic outcomes is unusually wide. Given this ambiguity, we prefer to avoid making aggressive macro forecasts.
Instead, we will finalize our 2027 positioning once the post-election landscape comes into focus, and we will keep this quarterly update brief.
Preview of 2027
This mid-cycle market has brought elevated volatility, driven by external risks: escalation in the Strait of Hormuz, persistent inflationary pressures, tightening financial conditions, capital availability constraints, the ongoing need to validate AI capital expenditure, and geopolitical and social instability in the Middle East and Europe. At the same time, counterbalancing positives exist. U.S.-China relations have stabilized, corporate earnings growth in both economies has reached multi-year highs with strong momentum, household balance sheets remain healthy, and consumer spending is selective rather than speculative. Crucially, current market behavior lacks the irrational exuberance of the 2000 dot-com peak or the uncritical "YOLO/TINA" mentality of 2021.
Established, cash-generative technology giants—such as Microsoft, Alphabet, and Nvidia—lead this technological cycle alongside high-profile upstarts. Unlike the tech leaders in the dot-com era, these incumbents leverage substantial operating cash flow to fund ongoing innovation, absorb startup challenges, and defend against disruption. Upstarts like OpenAI, Anthropic, and Perplexity lack comparable financial reserves. While larger incumbents may move deliberately, they have both the flexibility and willingness to pivot with startup spirit, along with governance structures that give founders free rein. Leaders including Alphabet, Microsoft, and Meta have demonstrated a clear willingness to make distinct strategic commitments in this emerging AI landscape.
The structural imbalance between insatiable AI demand and constrained supply persists. At the same time, market participants have grown increasingly skeptical of long-term AI returns, demanding proof before deploying more capital. We are now in a regime where firms generating durable operating cash flow and holding secure access to capital enjoy a decisive advantage over cash-starved upstarts. While enterprise adoption continues at pace, true supply-demand equilibrium remains a distant prospect.
Meanwhile, capital in private equity and private credit is contracting. Declining fundraising and tightening underwriting standards make incremental capital harder to secure. Many emerging players lack the credit profile conservative bank lenders or public bond markets require. When even an established incumbent like Meta evaluates equity financing over debt issuance, it signals a fundamentally more cautious and vigilant investment environment.
Accordingly, we maintain a clear preference for high-quality growth businesses operating in sectors with strong operating profit growth—qualities essential for navigating elevated interest rates and potential macroeconomic deceleration.
Finally, while substantial cash remains on the sidelines, we do not view it as active capital ready to drive prices higher. Dry powder of this nature typically gets deployed only after market dislocations have fully resolved.
Risk Management and Current Positioning
That said, our primary posture into 4Q is risk control: be nimble into year-end and maintain a healthy portfolio of hedges as U.S. corporate earnings reports arrive in early October amid the midterm elections.
Earnings expectations entering this season are elevated. When market expectations are high, asymmetry shifts unfavorably: tempered guidance from major technology hyperscalers risks being treated as a growth slowdown, while increased capital expenditure may be criticized as undisciplined spending. Concrete evidence of productivity gains or revenue expansion from AI investments remains scarce across most corporate balance sheets.
By maintaining a lighter risk profile, we preserve optionality to deploy capital when policy direction becomes clearer or if market volatility creates compelling entry prices. For instance, a Democratic sweep could slow power generation expansion and data center buildouts, potentially delaying earnings growth and triggering a market correction. Controlling exposure today ensures we can act thoughtfully rather than react under pressure.
This is a Mid-Cycle market, not irrational exuberance. The credit market is open and willing to take on more risk in investment-grade credit. Equity investors remain measured, prefer Growth at a Reasonable Price (GARP), and definitely not Growth at Any Price.
3Q26 Market Outlook
Markets Performance
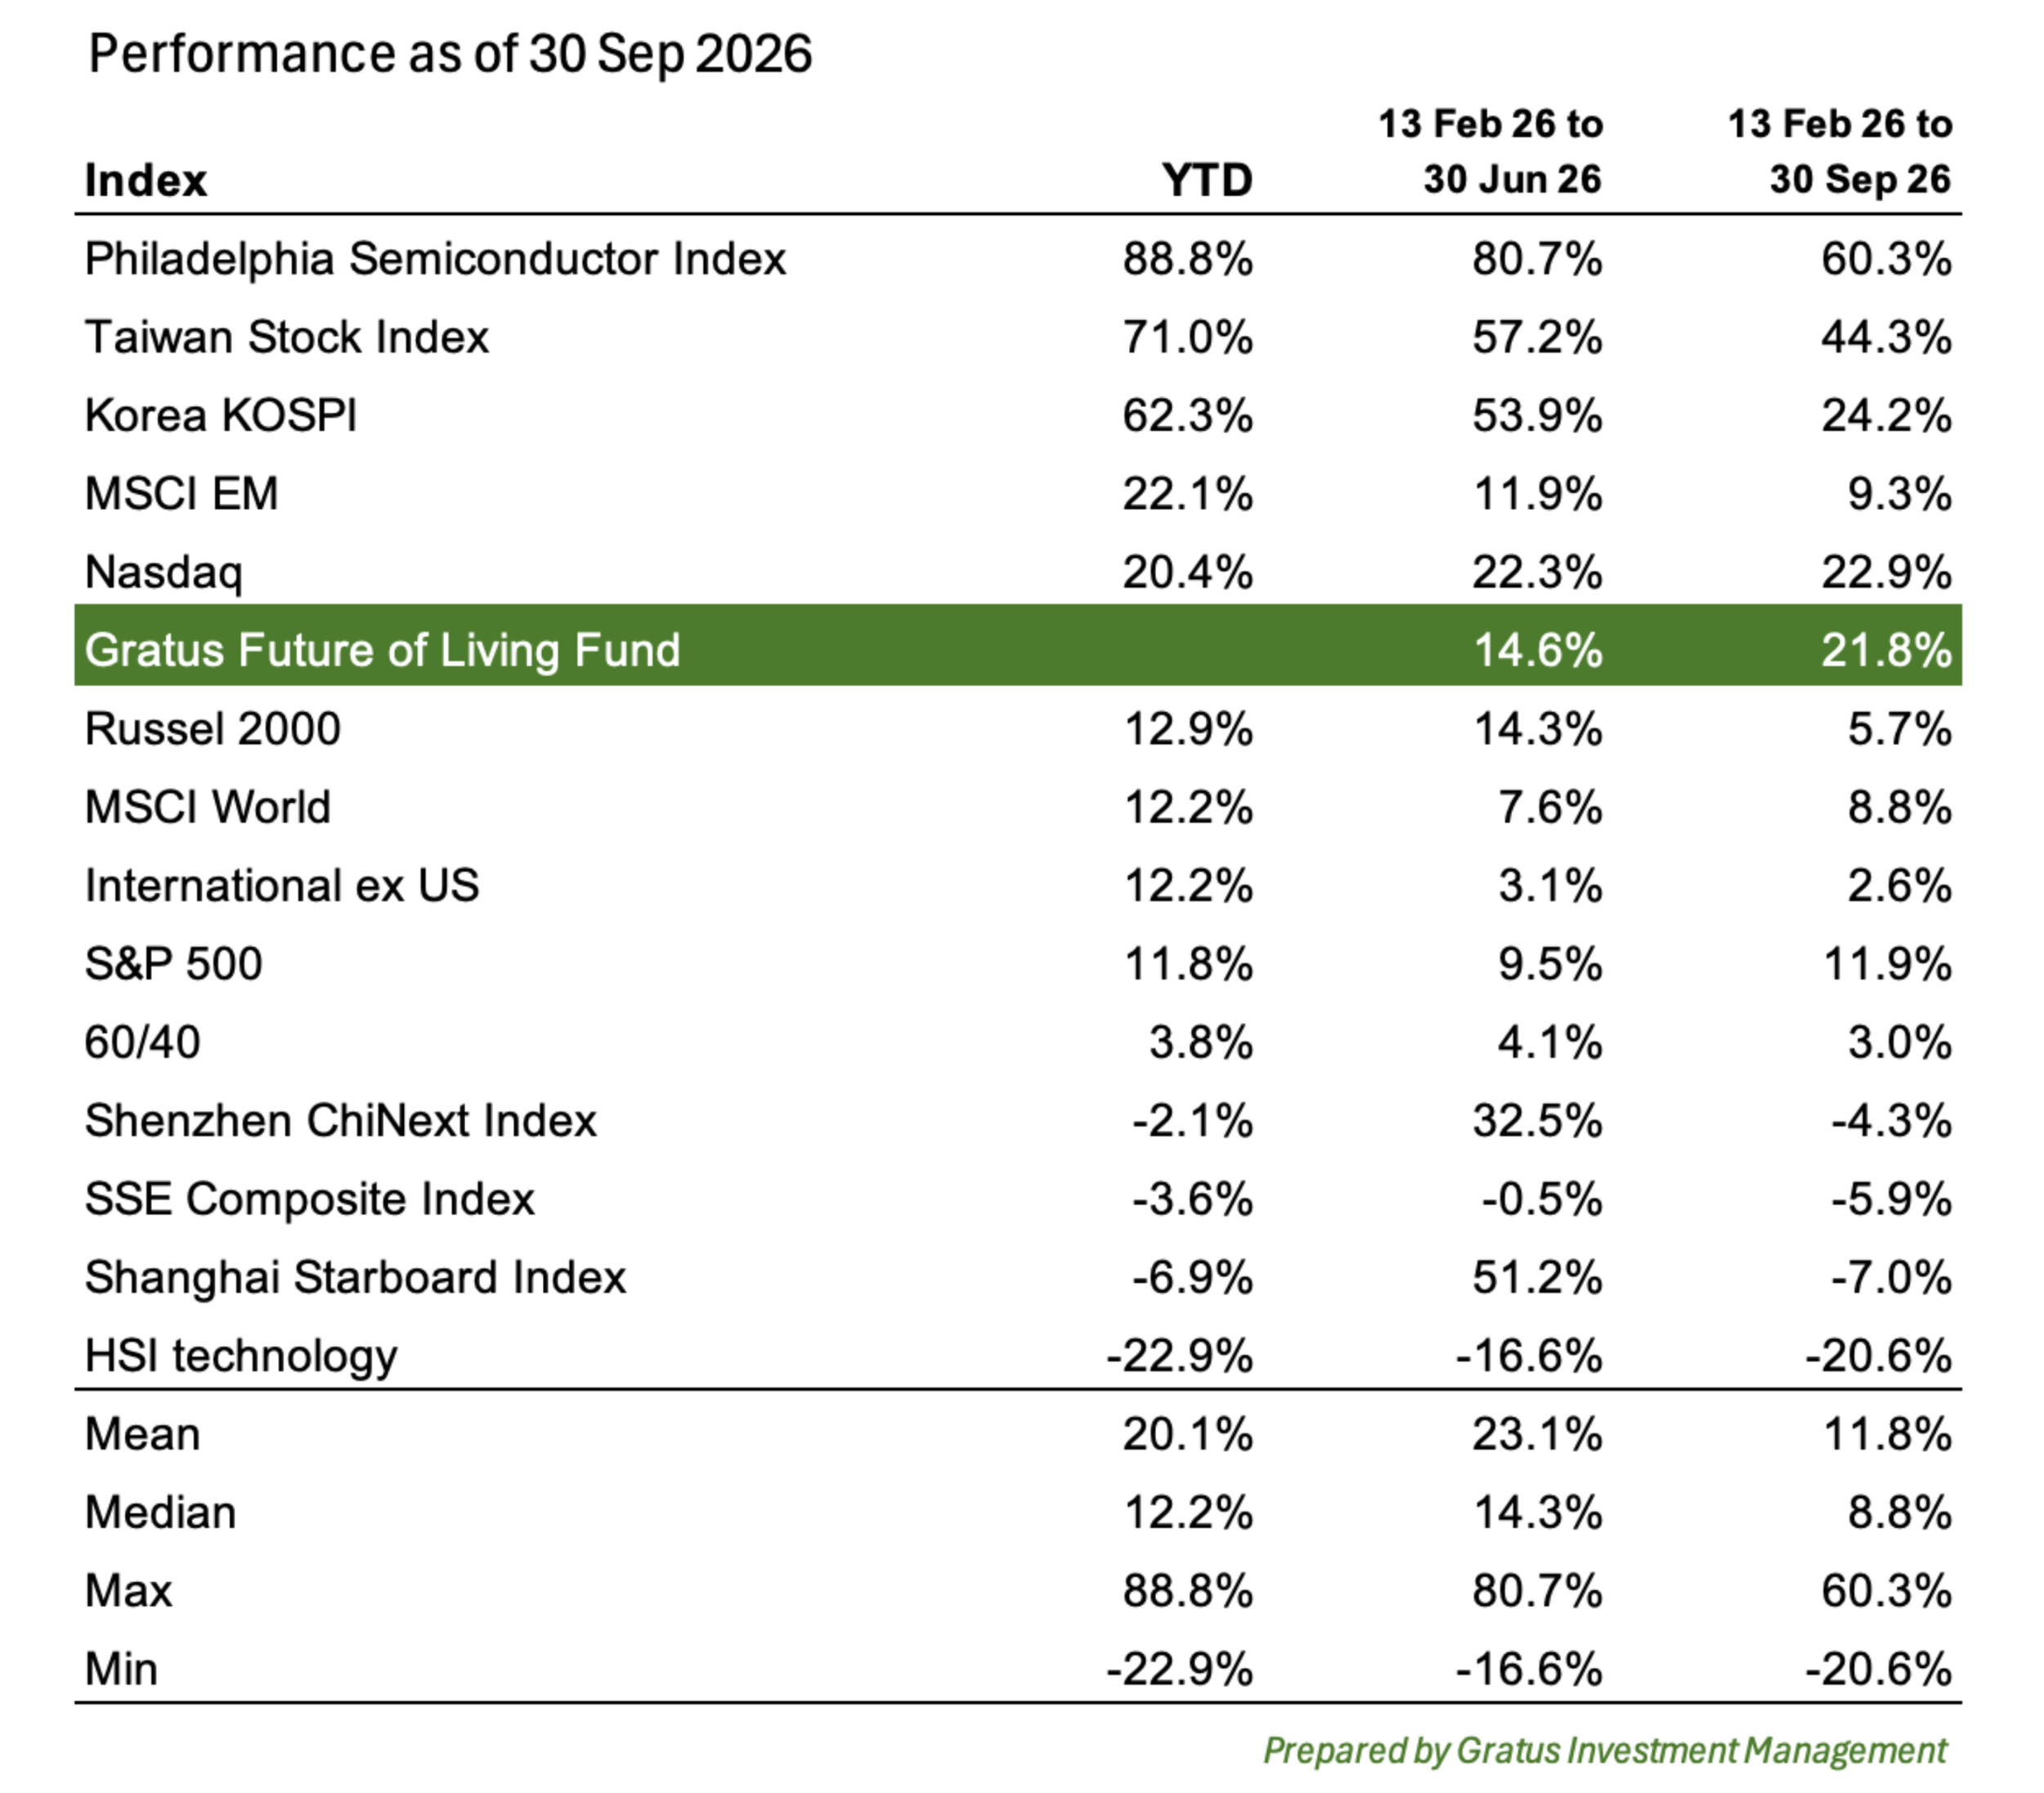
This year’s roller coaster market and its scorecard to date:
US Outlook
Mix Signal Dominates
The US economy is strong, supported by strong AI capital investment and strong corporate earnings growth of over 30%.
Employment has been steady, but wage growth is trending lower, hence not adding pressure to inflation; consumers are digging into their savings to fund spending. The savings rate is declining.
But the risk of high energy inflation filtering into the broader economy is evident, supporting higher Fed Funds rates to tame inflation expectations.
Employment
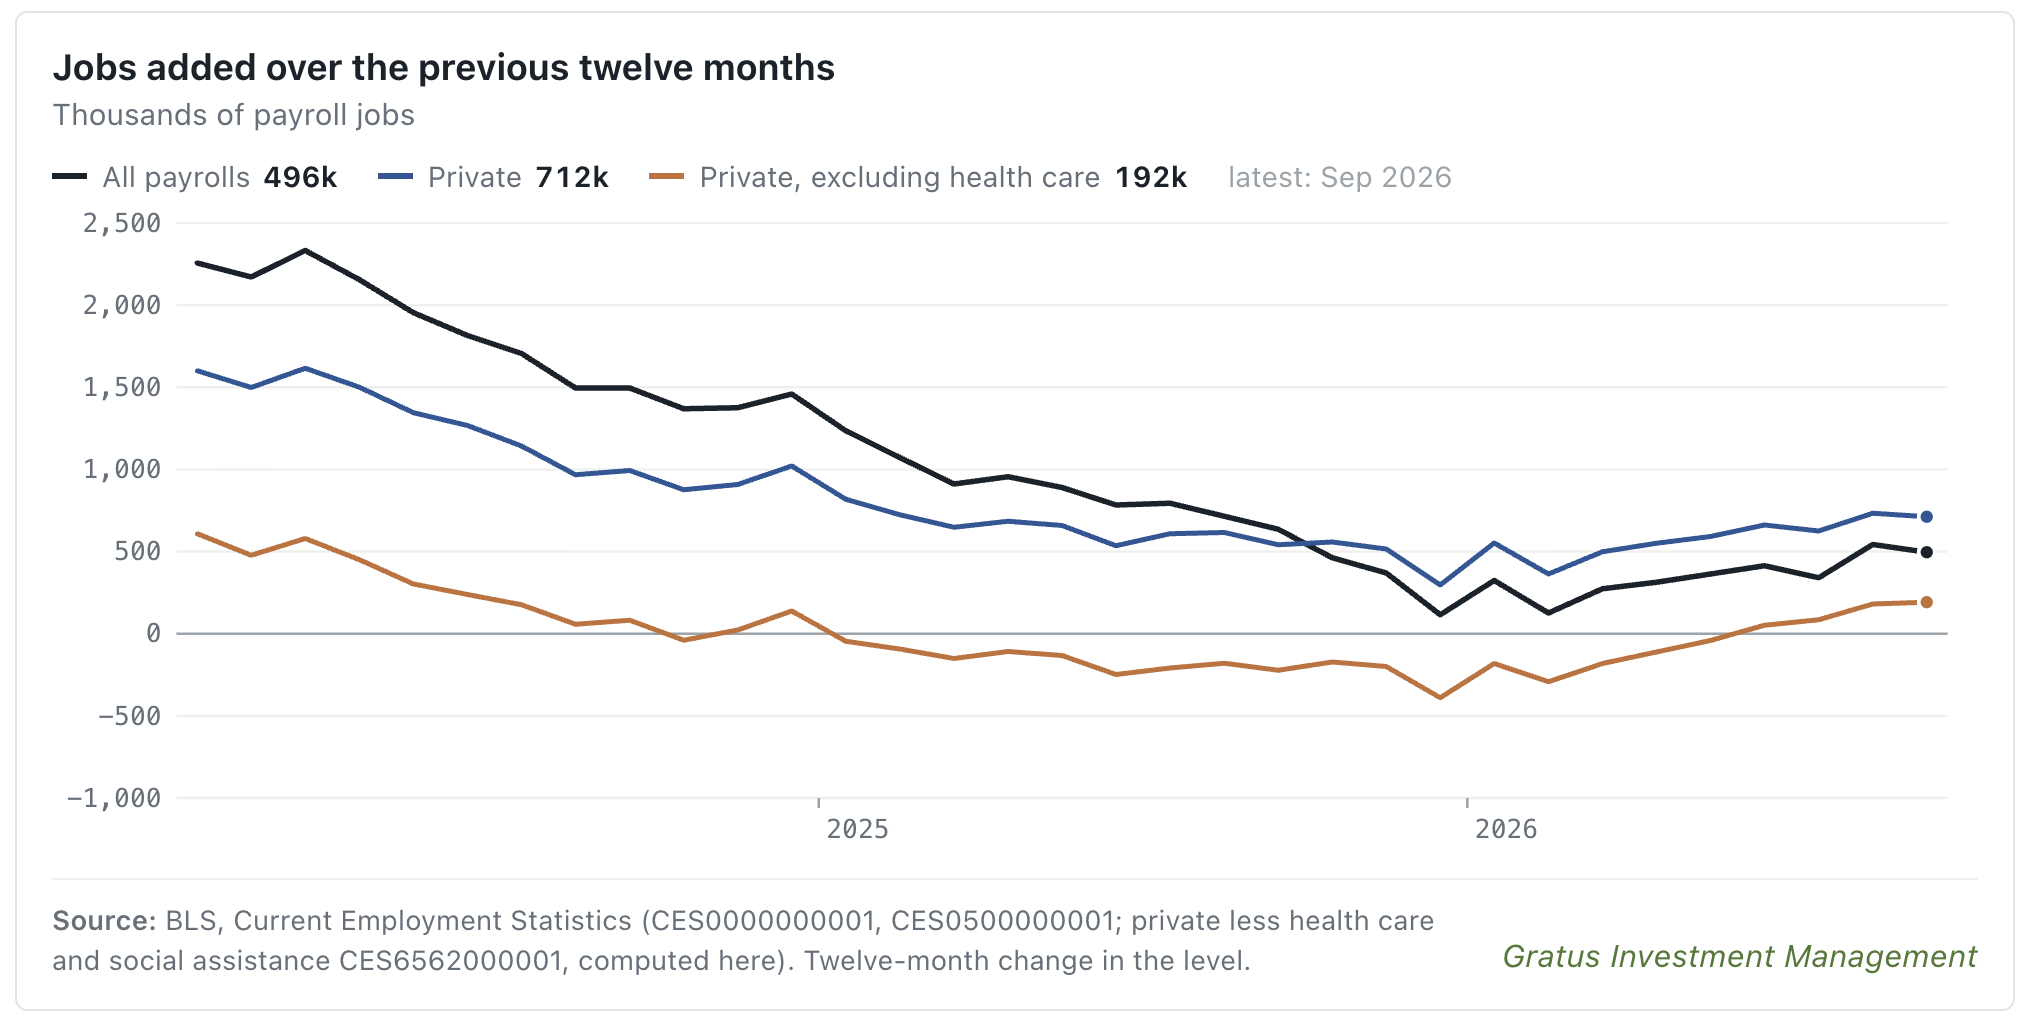
Ongoing investment in AI will drive the hiring cycle before any severe job losses.
The AI investment cycle currently dominates the labor market. Despite ongoing weakness in residential real estate, sectors such as data centers, power generation, equipment manufacturing, and tooling suppliers are growing strongly from the surge in AI buildout. Demand for specialized roles—including cooling engineers, construction engineers, and network specialists—remains robust, creating high-paying jobs that support strong consumer spending capacity. Consequently, employment in construction and manufacturing has shifted dramatically, from a net loss of 154,000 jobs a year ago to a gain of 149,000 jobs.
Widespread displacement of white-collar workers is unlikely in the near term, as experienced professionals are essential to validate and oversee AI-automated workflows. Qualified operators will ultimately be required, or the existing workforce will manage operations through natural retirement attrition. However, hiring for fresh graduates and junior roles will remain sluggish as corporate leaders prioritize AI investments over entry-level headcount, slowing the overall pace of new job creation.
Over the next 12 months, as AI implementation increases operational throughput, many organizations will need additional personnel to maintain stable operations. Conversely, companies that remain at the status quo and have less effective operational efficiency (revenue per employee growth) will start laying off to cover up the shortfall.
Real Wage Growth, Spending and Savings
Personal income rose 4.3% in the year to August, but, net of inflation it is barely 0.8%. This is down from 2.5% a year earlier and well below the 2.7% median since 2000. This is driven by a multitude of factors, higher logistics costs from diesel being one, higher import prices, tariffs, and others are putting pressure on consumers. Real disposable income fared slightly better at 1.3%, helped by tax payments.
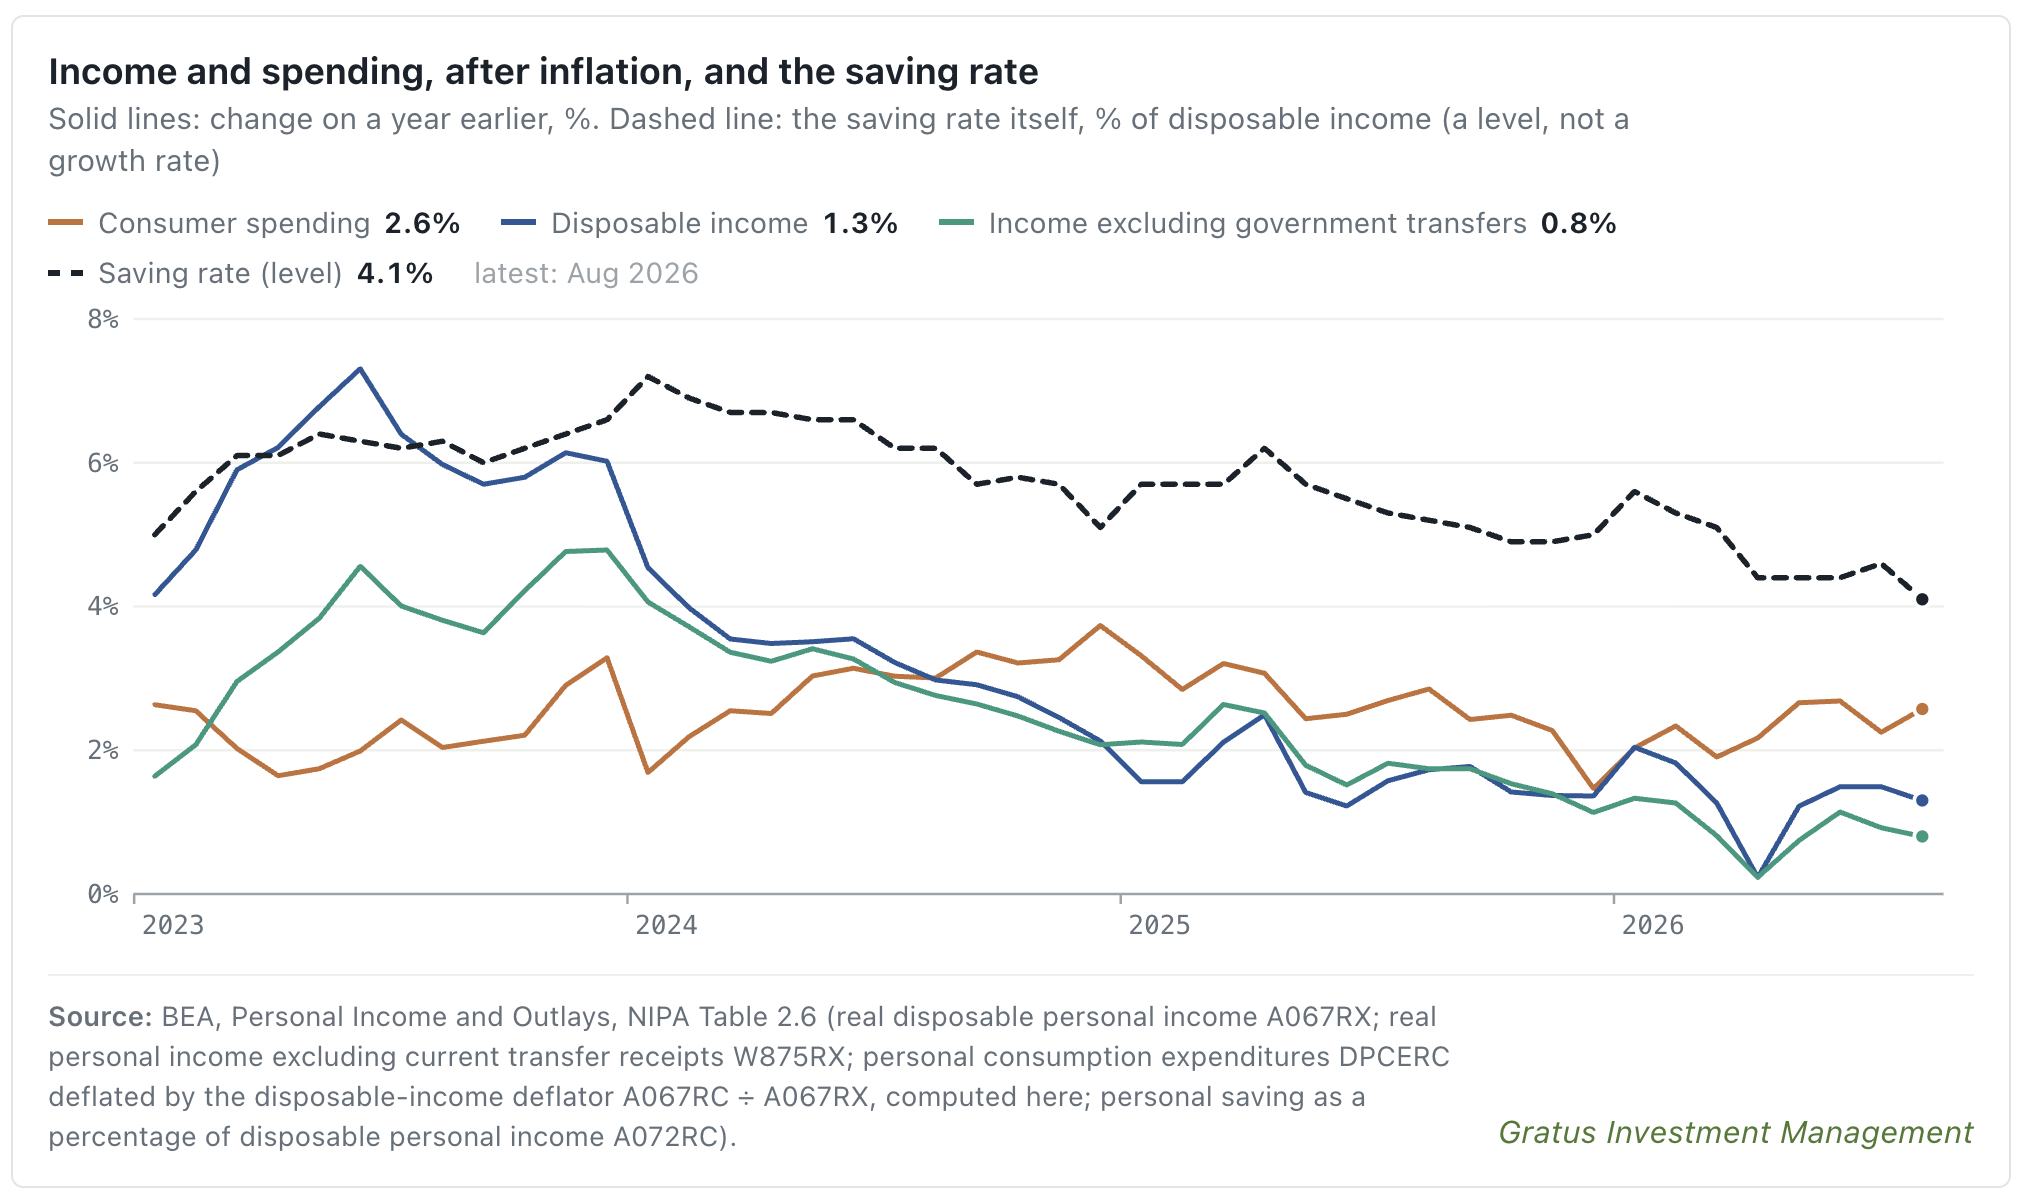
Spending, by contrast, is running well ahead of income. Real consumer spending rose 2.6% over the year, twice the growth in real disposable income. August was particularly strong: spending rose 0.6% in real terms, and 14 of 16 categories were higher. Big-ticket goods led the gains, with motor vehicles up 7.6% in real terms and durables up 4.6%.
Gasoline - households bought 3.5% less while paying 24% more.
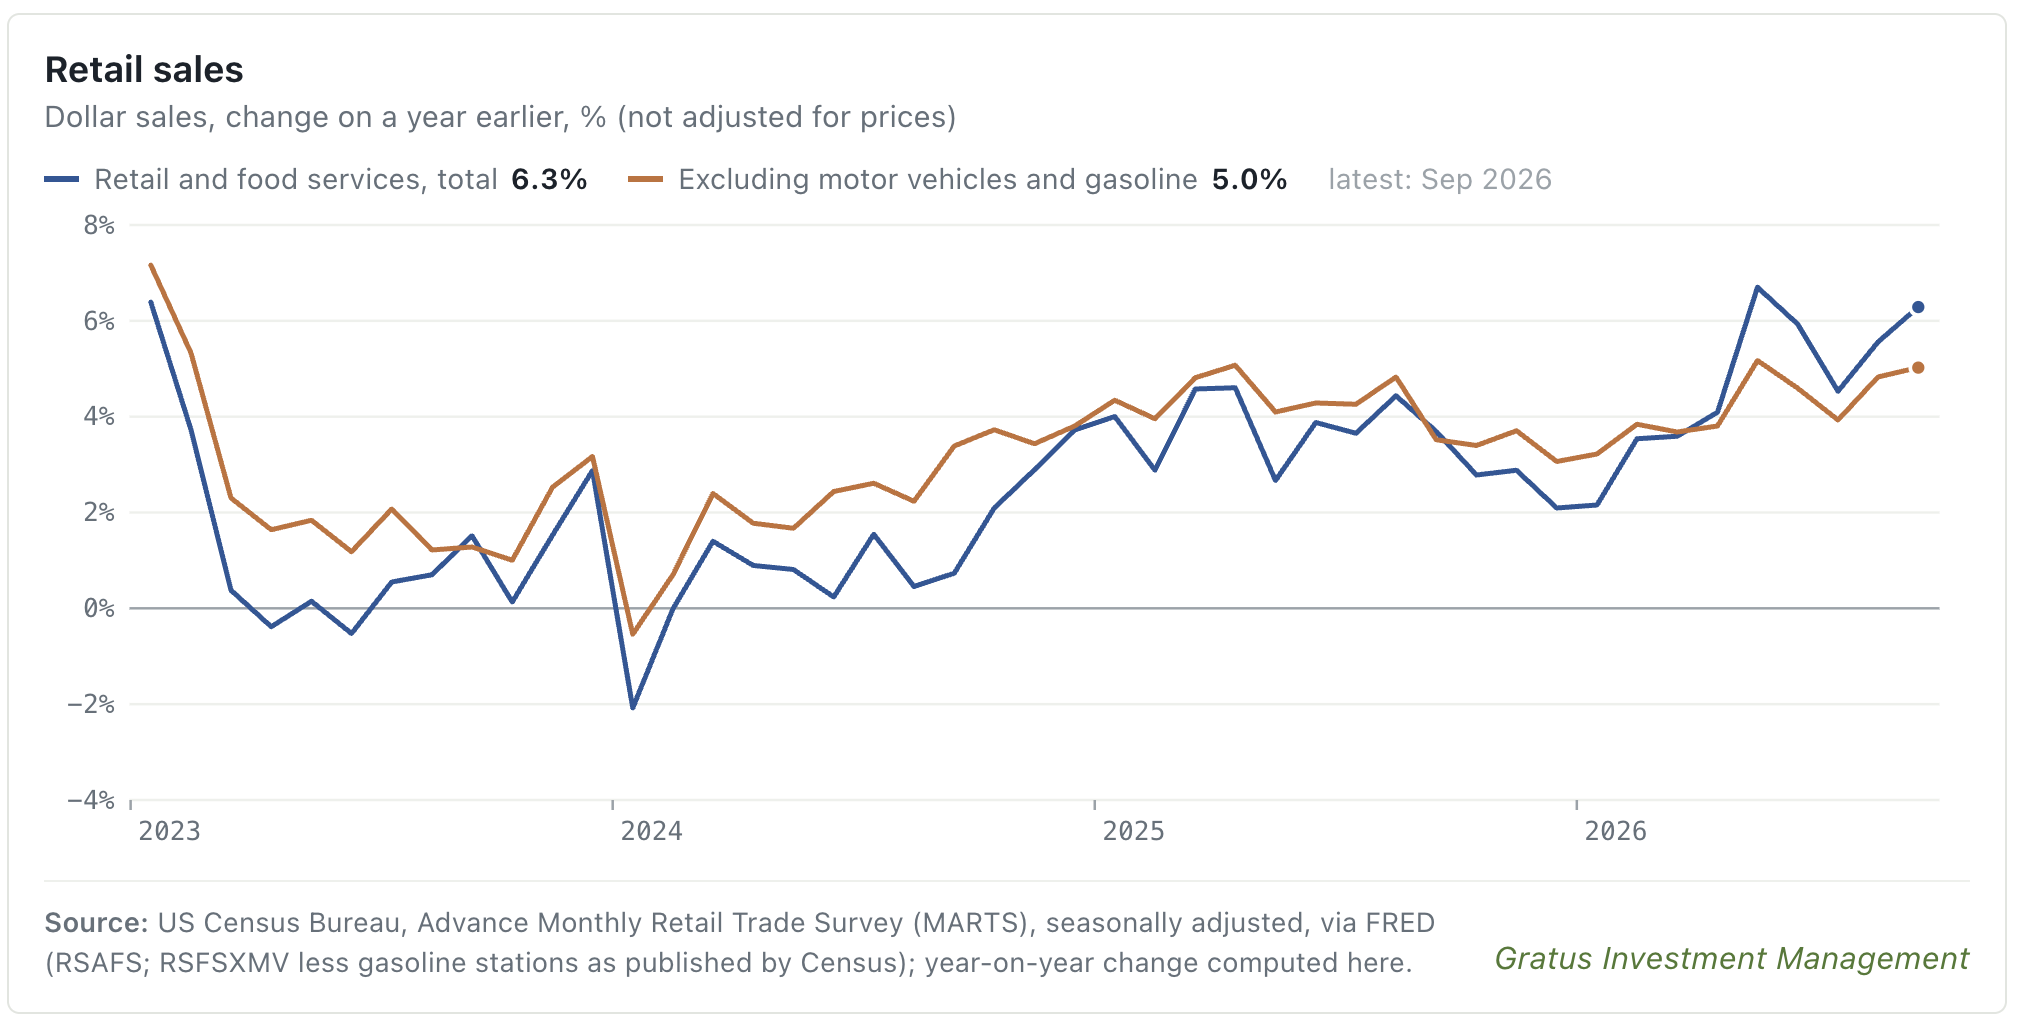
Households have absorbed the energy shock without cutting back on durable goods, which points to underlying confidence. Retail sales rose 5.4% in nominal terms and 4.7% excluding autos and gasoline as the holiday season approaches.
The gap between spending and income is being funded by lower savings. The saving rate fell to 4.1% in August from 5.2% a year earlier. That is its lowest level since November 2022 and below the 5.5% median since 2000. In real terms, households are setting aside 20% fewer dollars than a year ago. This is the main constraint on the consumer outlook.
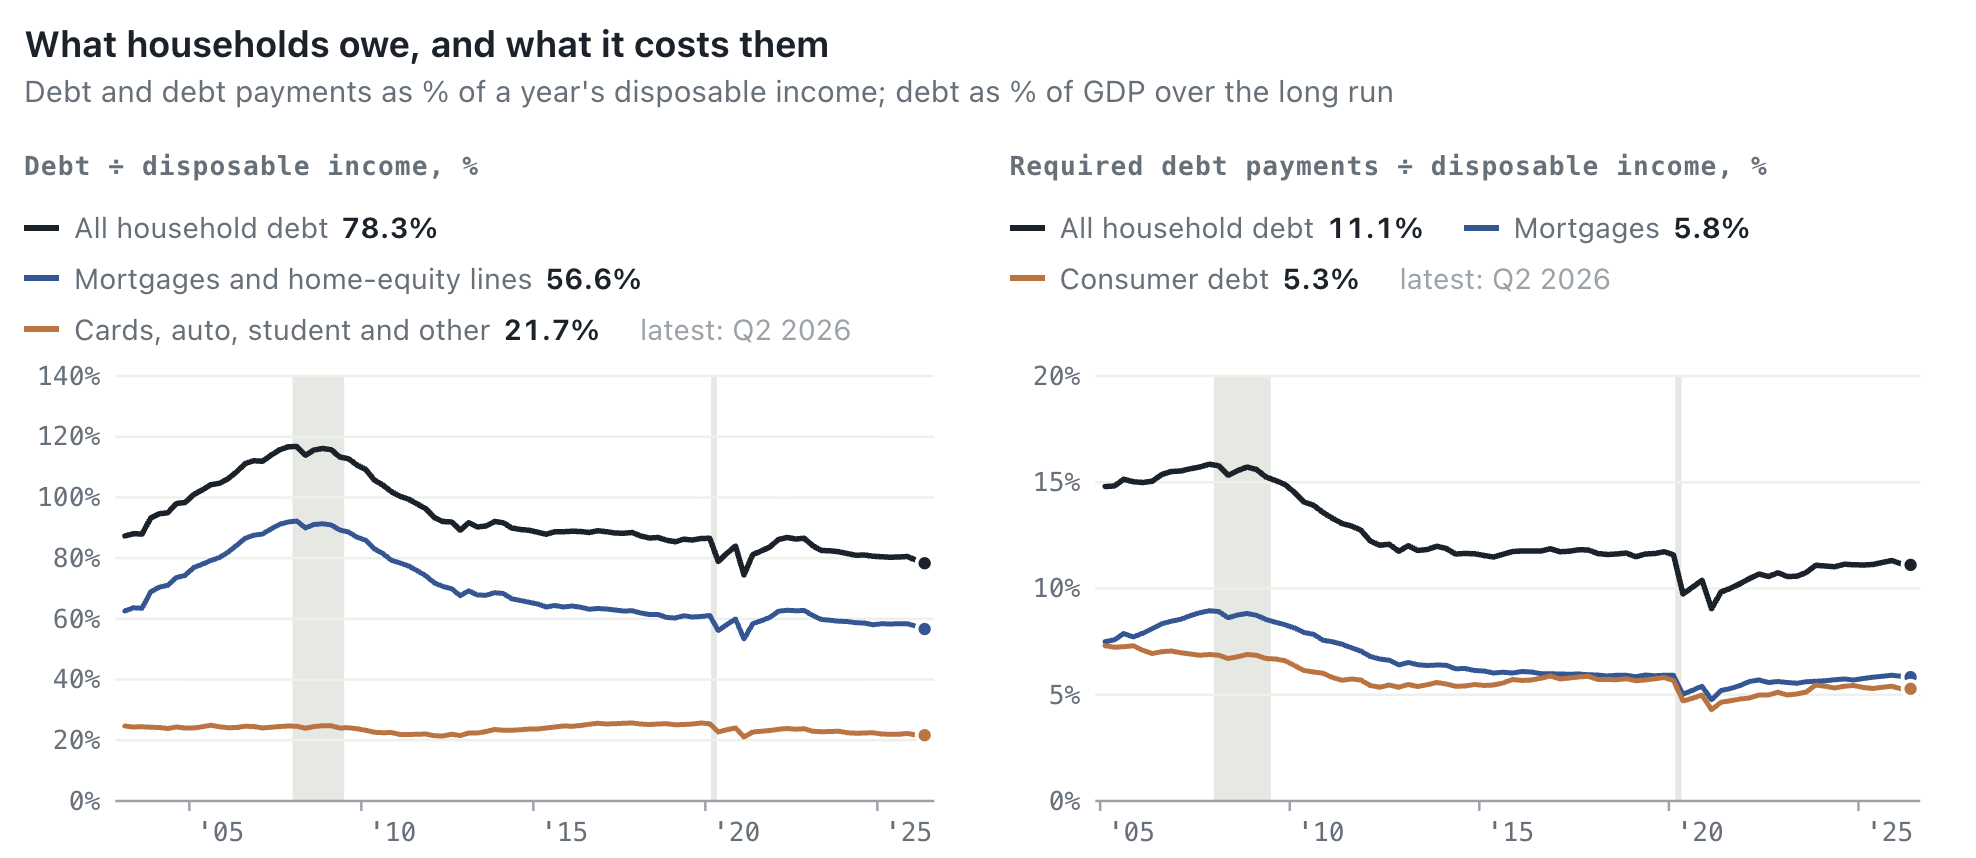
Household Debt is in a healthy position.
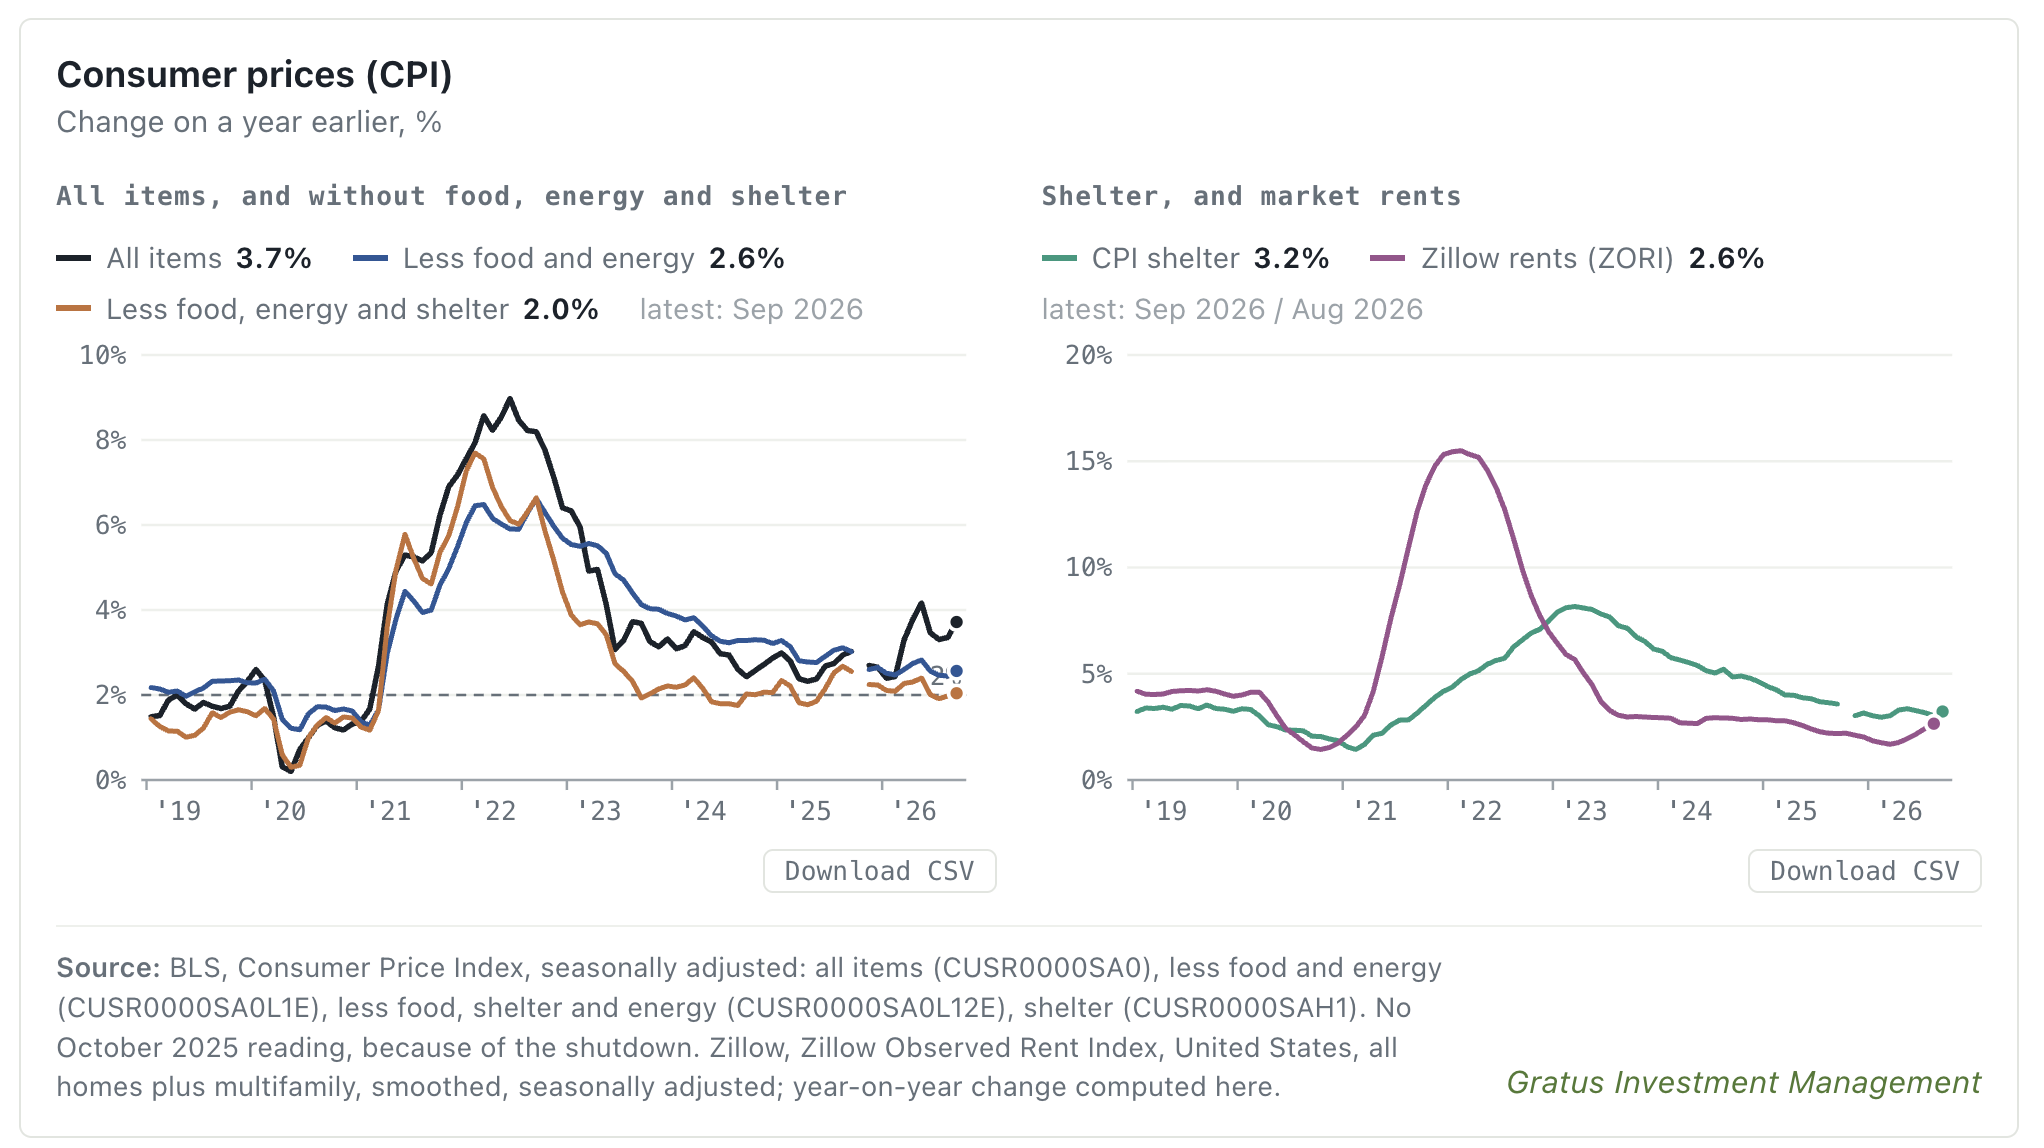
The inflation trend is pointing up
If Chairman Warsh’s concern is the trajectory of inflation, numerous indicators suggest that the end of the Iran war and the reopening of the Strait of Hormuz will lead to energy prices normalizing. With energy prices still at $100 and diesel twice as costly at $6.50, inflation is unlikely to be mere noise, unlike what we considered last quarter. Rising transportation and logistics costs are spreading through every part of the American and global supply chain. Unfortunately, there is no easy way to dismount from riding a tiger. This is Trump’s self-inflicted wound, which has derailed his campaign promise and disrupted the Treasury Secretary’s economic plan.
Headline CPI rose 3.7% through September, up from 2.4% in February. Nearly all of this increase came from energy inflation. Shelter, the biggest dampener on CPI and over 33% of the index, may become less of a drag: high-frequency data from Zillow’s market rent index show rental cost inflation accelerating from 1.7% in March to 2.6% in August.
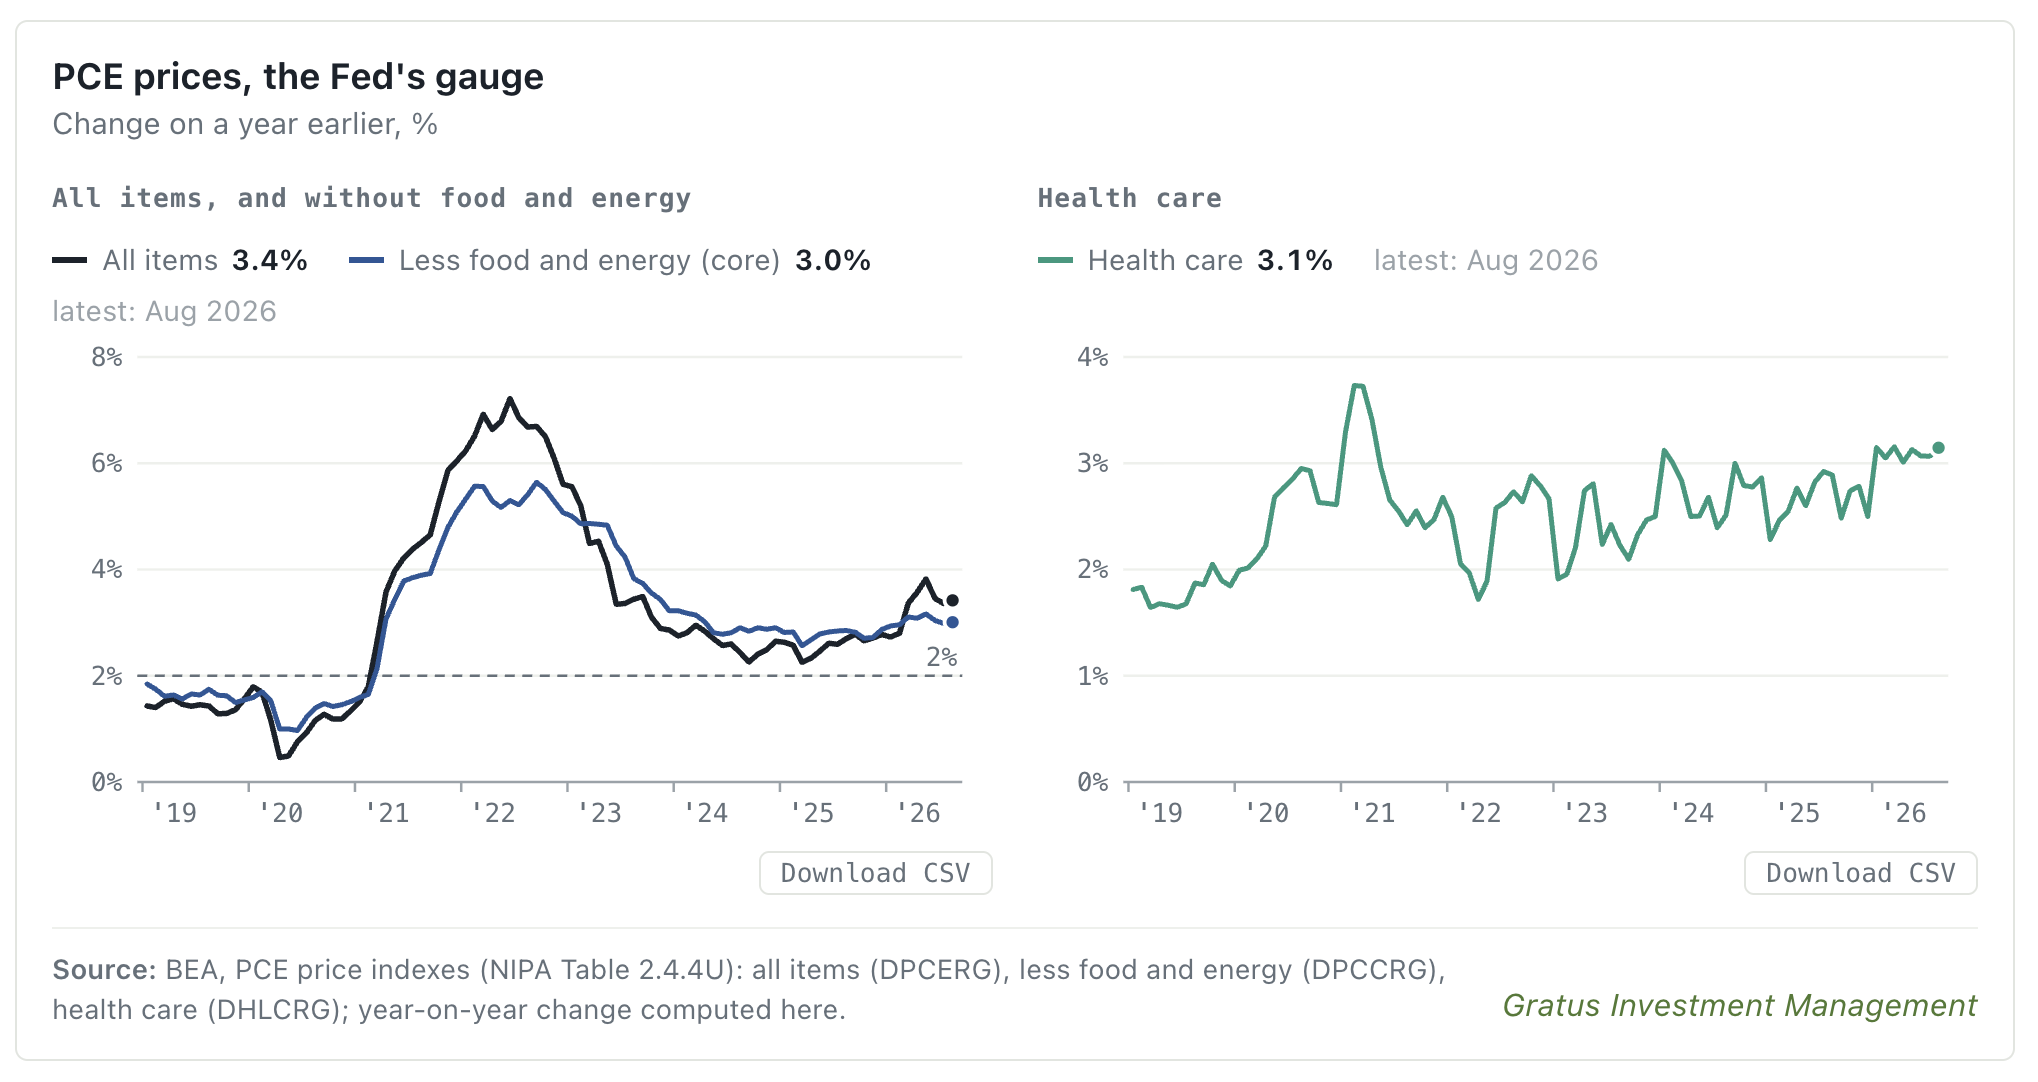
The Fed’s preferred gauge corroborates the CPI data. Headline PCE is up 3.4%, while core PCE is up 3.0%. Core inflation has held between 2.7% and 3.2% for twelve months—stable, but not falling. Health care and housing are the largest contributors. Health care inflation, which makes up 19% of core PCE, has hovered near 3.2% for several quarters.
Producer prices reinforce our view that inflation is trending upward and tell a more pressing story. PPI final demand rose 6.3% through September, while core PPI, which excludes food, energy, and trade, rose 5.04%. Oil explains much of the increase: energy and transport account for 2.5 points of the 3.0-point rise since February, with diesel up 115% and truck freight up 19%. Meanwhile, services and businesses are using this opportunity to raise prices, which largely show up as improving margins in earnings reports.
China is adding upstream pressure: PPI turned positive in March after 41 months of deflation and reached 5.0% in September 2026.
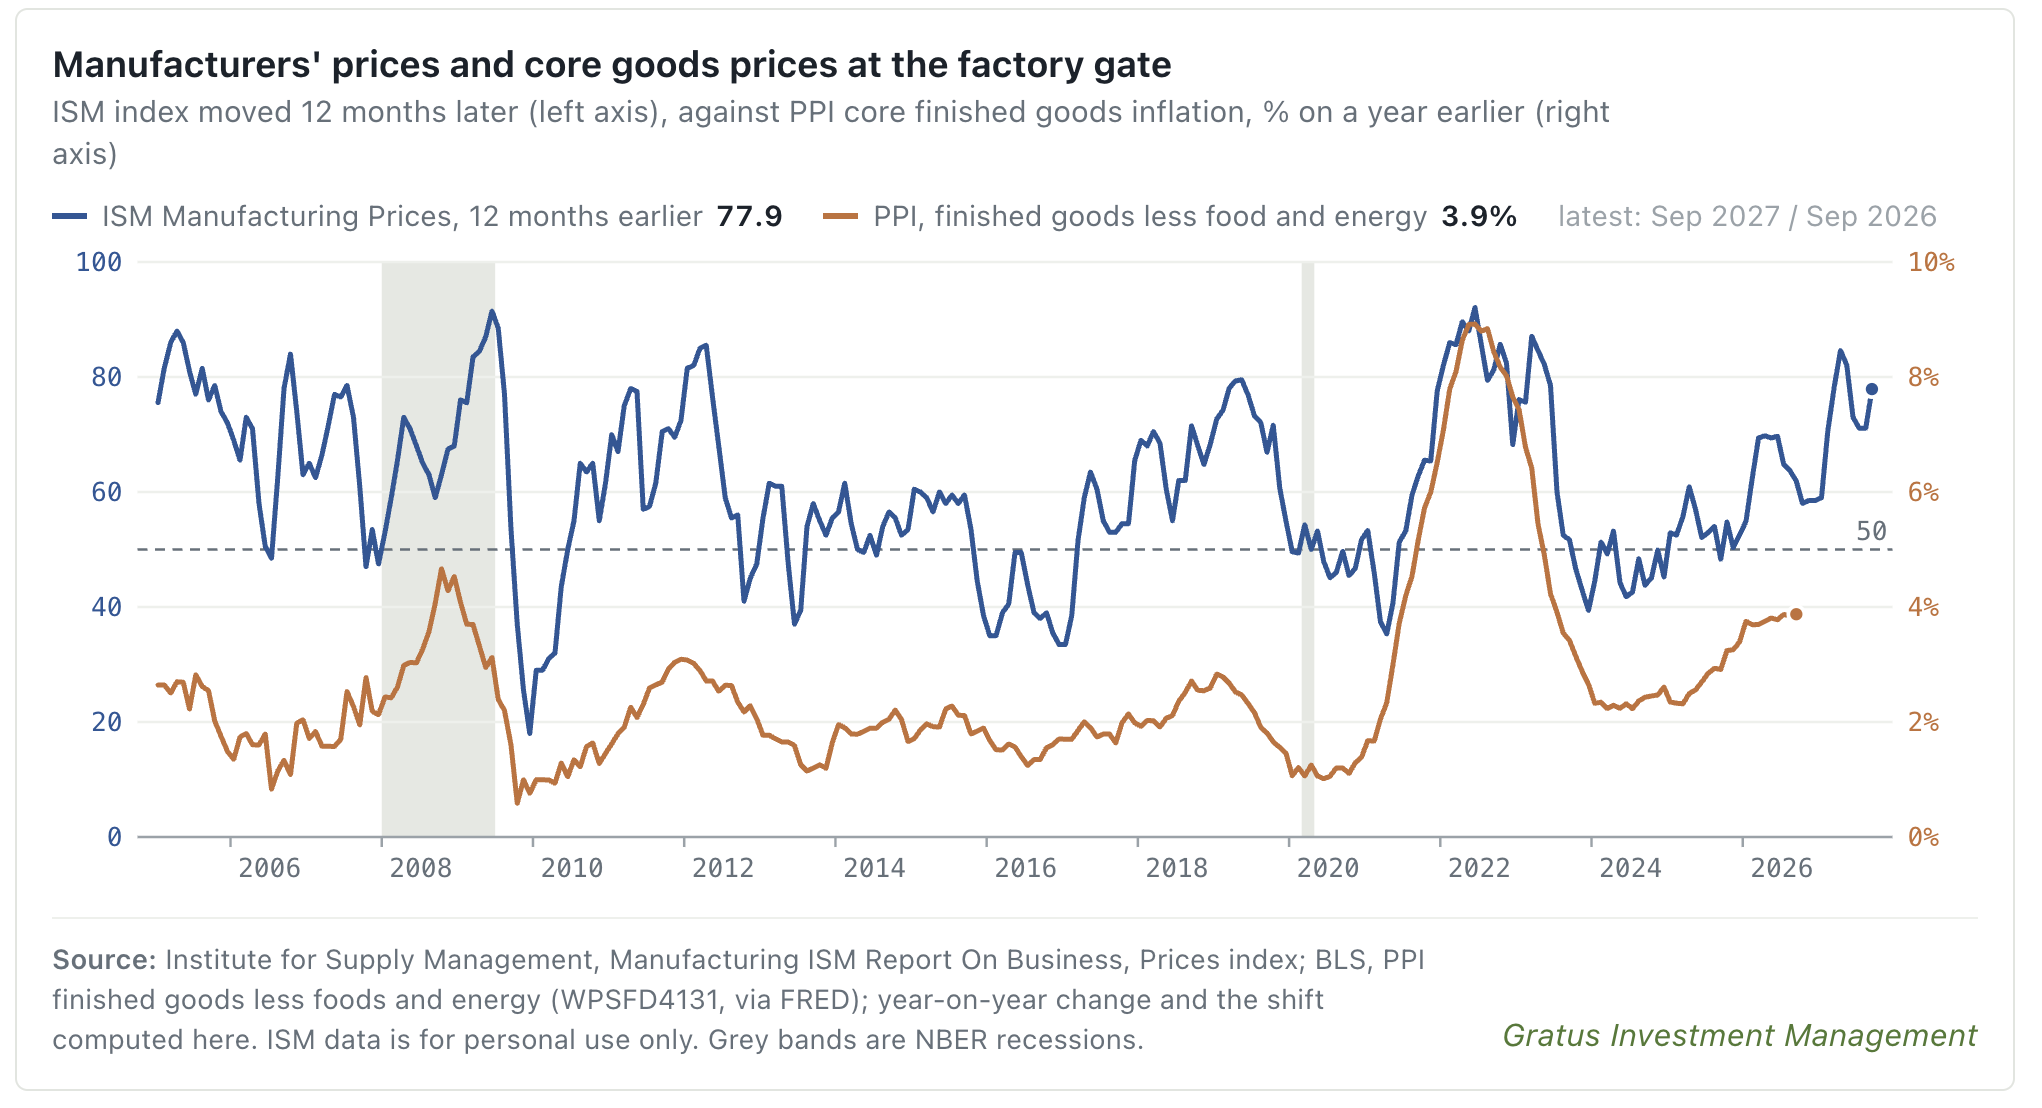
Another measure that offers some clues is the ISM Manufacturing Prices. It leads core finished-goods PPI by about a year; it jumped to 84.6 in April amid the oil shock and stood at 77.9 in September. If these relationships hold, the upward pressure on core prices is not finished.
Historical Corporate Earnings Growth
Corporate margins remain near record highs. In Q2, after-tax profits accounted for 16.9% of corporate value added—just below the record peak of 17.0% set in Q2 2021.
The projection for 3Q26 is aggressive at 29.6% growth; it would mark the third consecutive quarter with earnings growth above 25%. This is extraordinary.
Such strong corporate earnings would provide a supportive backdrop for steady economic growth.
The risk is continued energy-led high inflation that could dent the plan in 2027.
Monetary Policy
The risk-management hike won’t be the last. The trend points to at least one more before year-end, followed by several in 2027.
Before you move on . . .
Market Dynamics
Treasury Yield, War, Fiscal, Credit
Financial Crisis -> Credit Crisis
Fixed income markets provide valuable signals regarding structural risk and capital pricing, often acting as an early indicator before vulnerabilities become apparent in equities.
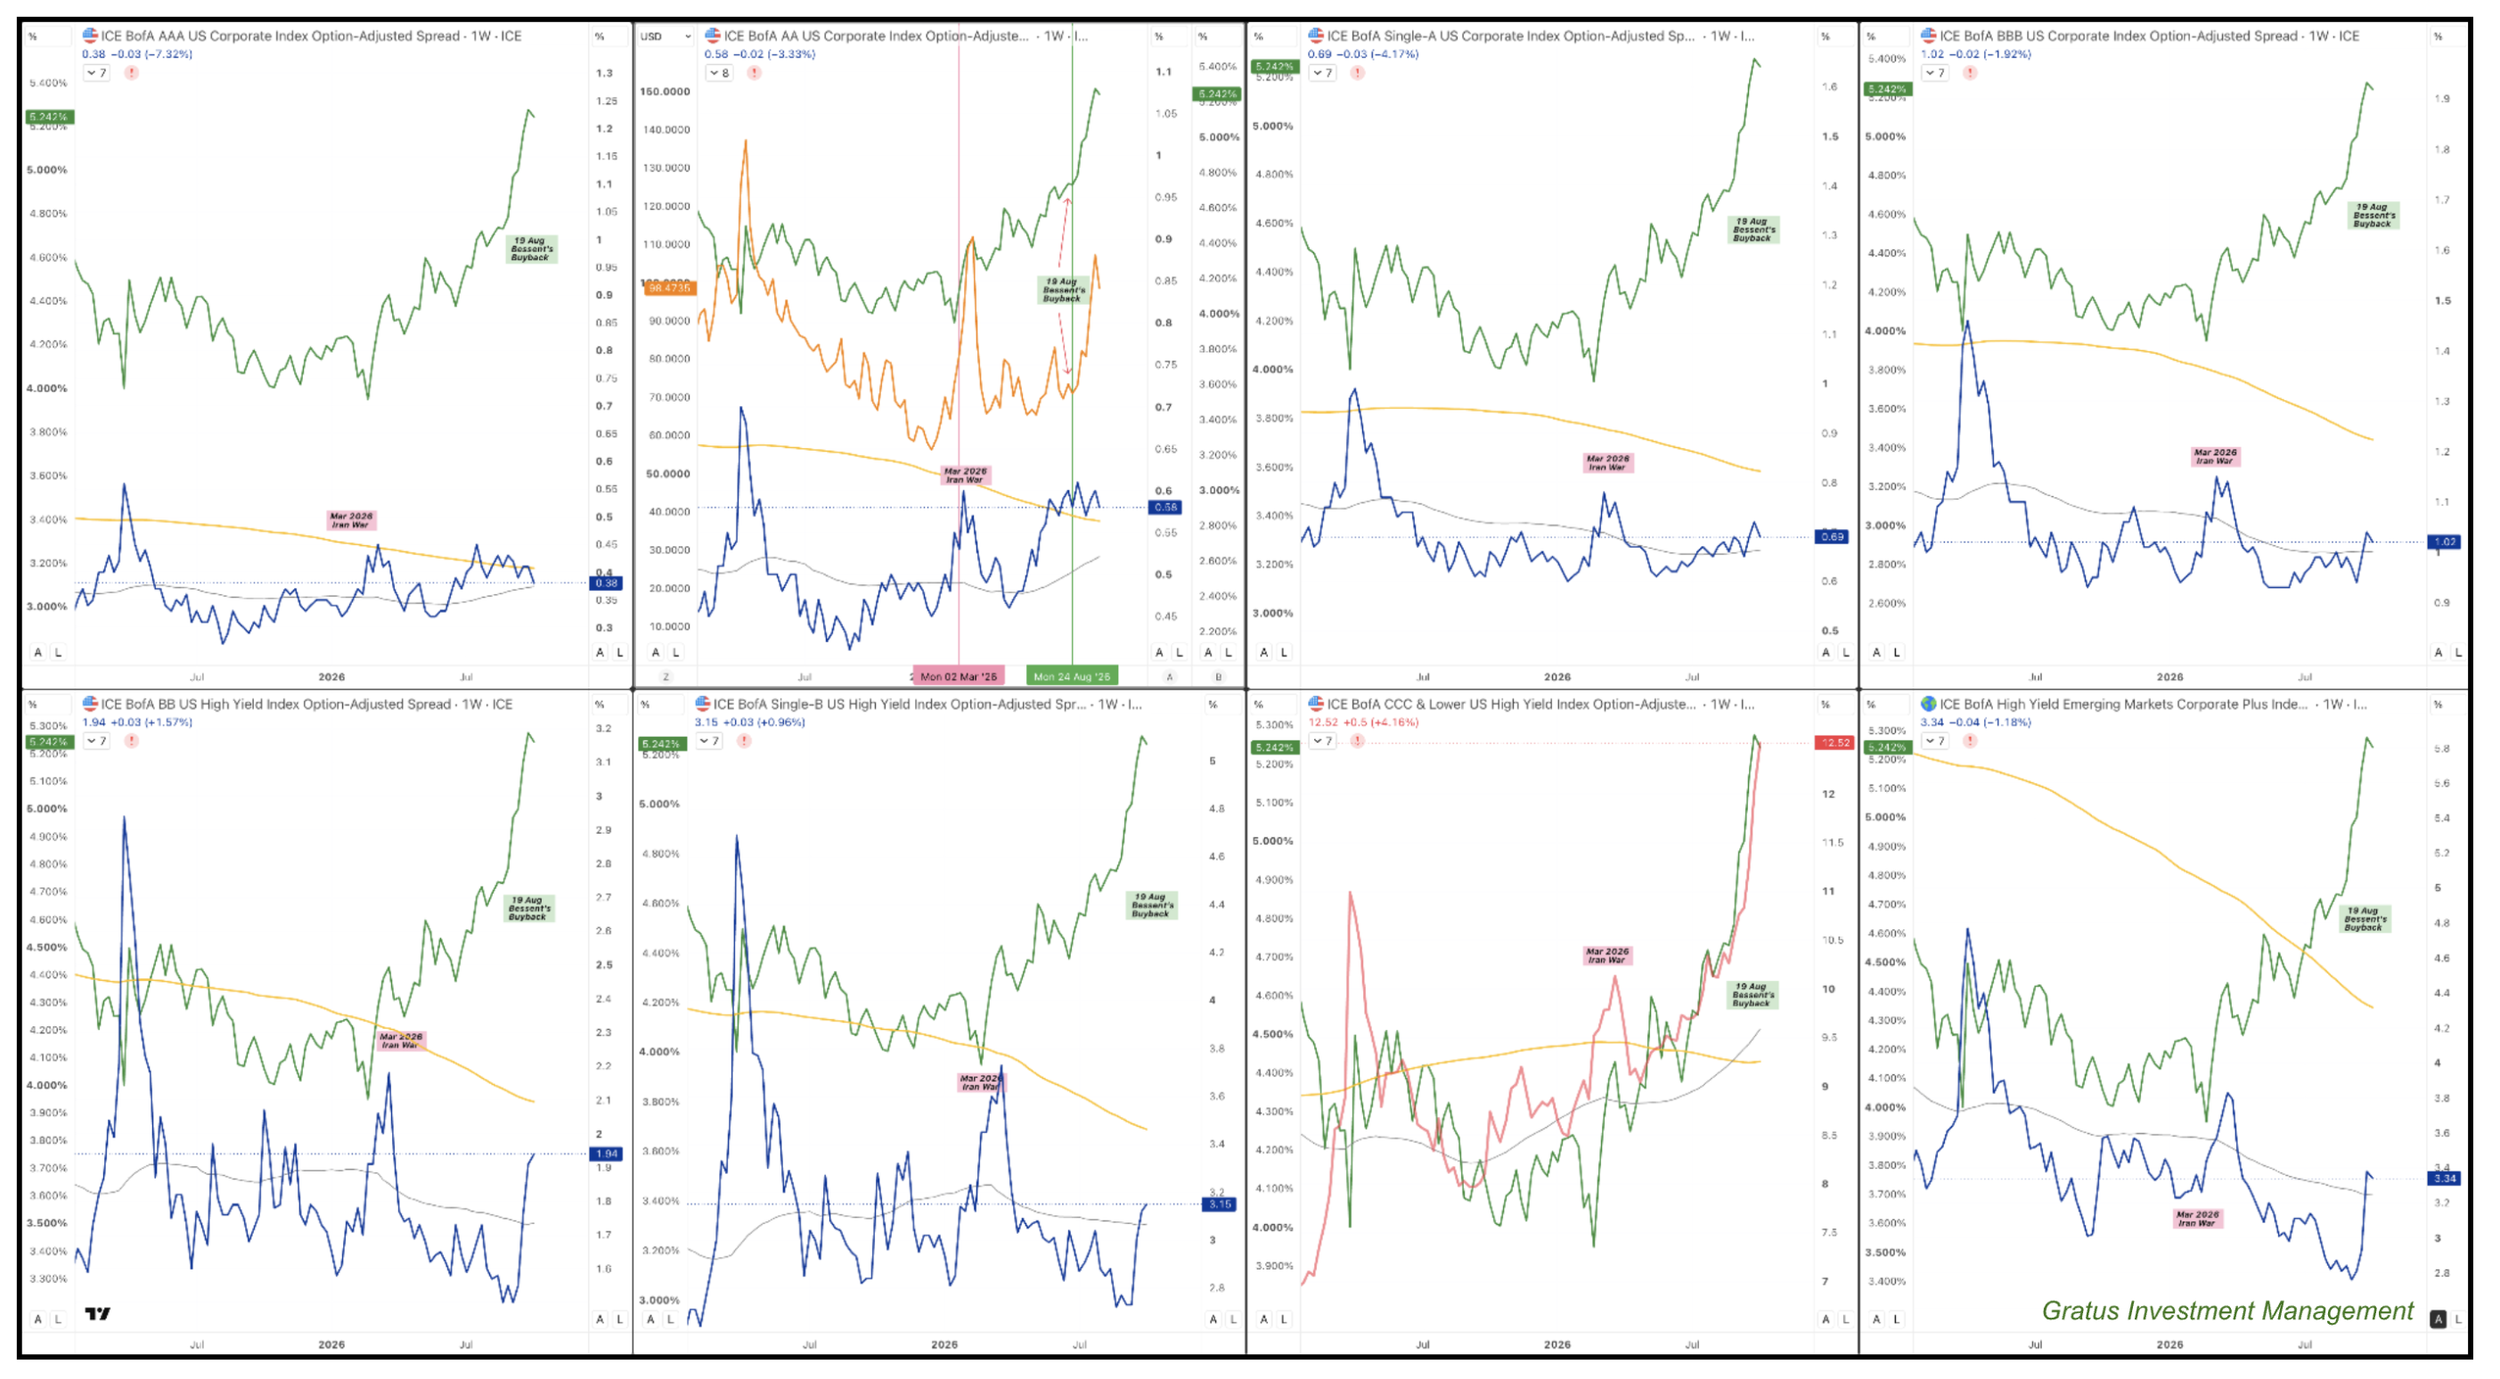
Below are 6 charts of the US AAA-to-CCC indices and the EM HY spread index that provide good signals.
Some legends and explanations for the charts above.
The six charts display BAML's credit spreads for AAA, AA, A, BBB, BB, B, CCC, and EM HY in blue, with the CCC curve in red, and the 10-year US Treasury yield in green.
In the second chart, several key reference points are relevant across all six charts: the MOVE Index (BAML Bond Volatility Estimate, similar to the VIX for bonds) shown in orange; the US-Iran conflict outbreak in pink; Treasury Secretary Bessent’s remarks about "asymmetric information" in soft green; and the March 2025 baseline, marking Trump’s "Liberation Day."
The MOVE Index serves as a reliable barometer of mounting risk. This was evident in the surge before Liberation Day, the escalation on February 26 ahead of the US-Iran conflict, and the sharp spike after Bessent’s verbal intervention. That intervention unsettled bond vigilantes and professional traders. Despite Bessent’s hedge fund background, it is astonishing that he made such a mistake, demonstrating the US government's arrogance and lack of humility. Naturally, hedge funds, professional traders, and foreign investors would reduce their exposure or take positions against such overconfident declarations from government officials. More importantly, government bond yields in many developed countries also rose, giving these foreign investors opportunities to return to their home markets, where they may better understand government policy.
The US Treasury Market
The 10-year Treasury yield is the market’s primary gauge of fiscal discipline and sovereign credit risk.
The Trump administration has demonstrated inconsistent commitment to fiscal restraint, accompanied by vague, poorly projected policy proposals. Many public statements and policy shifts appeared ad hoc. While some initiatives may have succeeded, many lacked strategic depth.
For bondholders, whose potential upside is capped, such unpredictability erodes confidence. As the perceived risk of policy error grows, disciplined investors demand higher compensation for taking on incremental risk.
Two notable events marked 2026. The attack on Iran and Treasury Secretary Bessent's verbal intervention.
US-Israel attack Iran
The outbreak of hostilities in March triggered a controlled, orderly rise in US Treasury yields. While bond market volatility — captured by the MOVE Index — initially surged to 111, it rapidly compressed to 65 despite persistent upward pressure on benchmark rates, demonstrating underlying structural resilience.
Although net energy exports buffered American fiscal balances, supply disruptions levied high costs on Asian industrial hubs dependent on Strait of Hormuz shipping lanes for four-fifths of their fossil fuel needs. Meanwhile, European economies endured rising input costs across energy and agriculture throughout 2026.
Consequently, long-term inflationary pressures remain structurally anchored, fostering a welcome stabilization in fixed-income volatility and benchmark curve behavior.
Treasury Secretary Verbal Intervention
By late July and August, market psychology shifted as Treasury Secretary Bessent initiated a series of direct policy interventions, including Yen FX operations and verbal attempts to anchor bond prices. Rather than reassuring investors, these actions undermined confidence in official policy. When market participants question government credibility, they act accordingly: selling pressure intensified, driving 10-year Treasury yields from 4.65% in late June to a peak of 5.36%. A 71bps backup at this pace underscored the significance, questioned the administration's integrity, and was as uncertain as a military conflict that drove 10-year yields up 73bps from 3.95% to 4.68% from March to April.
To truly calm the market, traders need to regain their trust in the government's management of fiscal policy.
Long-Term Bond Investors
At these levels, long-term investors should naturally take notice — yields of this magnitude have been absent for over two decades. Recent Treasury auctions were positive during the week of 5 Oct 26, with strong indirect bidders taking the majority (80% and 73%) in the 9-year and 30-year auctions, and a good bid-to-cover ratio of over 2.77 and 2.54, better than expected. Despite the Faux Par of Treasury, long-term domestic investors are returning.
Take Away
Yet prudent market participants will first assess the broader macroeconomic picture. That analysis points to a clear takeaway: structural inflation remains contained, while ongoing productivity gains from technology and automation should exert disinflationary pressure. A bullish steepening of the yield curve remains plausible once confidence in the administration is restored, though clarity on that front is unlikely until after the midterm elections.
Crucially, the United States is not in the same category as chronic fiscal casualties like Greece, Argentina, or Turkey. A sovereign debt crisis is far from the baseline outcome.
On the Credit Front
When war broke out in March, spreads on AAA and AA credit widened initially, but quickly retreated. A similar recovery occurred across A-, BBB-, BB-, and B-rated debt.
By July, however, AAA and AA spreads expanded back to their March peaks. A wave of new corporate supply hit the market just as 10-year Treasury yields moved above 4.5%. This signaled a shift: investors, satisfied with second-quarter earnings, saw little reason to accumulate or hold top-tier credit at historically tight valuations.
Yet over the same period, spreads for BB, B, and Emerging Market High Yield continued to contract. In typical cycles, rising interest rates heighten default risk and foster risk aversion. Today, however, investors appear largely unconcerned by credit risk, moving down the quality spectrum in pursuit of yield, spread, and incremental return.
This risk tolerance is not entirely unconstrained. Market participants have drawn the line at CCC-rated debt, where spreads have barely recovered since March and continue to widen as benchmark yields rise.
One might expect Emerging Market High Yield to track CCC dynamics; instead, it has mirrored US BB and B credit, continuing to tighten despite higher rates. This divergence indicates that current anxieties are localized to US fiscal and financial health rather than a global retrenchment.
By September, following Treasury Secretary Bessent’s remarks, the market had woken up to an escalation of risk. Spreads on BBB, BB, B, and EM HY debt widened sharply as investors demanded greater risk compensation, concerned that higher rates will stay higher for longer. Concurrently, AAA, AA, and A spreads held firm or tightened, reflecting a classic flight to quality.
Looking ahead, this environment will test weaker borrowers. As upcoming maturities require refinancing, lenders will demand wider spreads and stricter covenants, raising the probability of defaults and distress among lower-rated issuers.
This explains Meta's move to raise equity over debt, as SpaceX was quicker to tap the market one week after earnings results, one step ahead of Zuckerberg. Musk’s team has more experience with the debt market and moved first.
Debt capital raising will now face closer scrutiny. As demand for funding grows, credit spreads can widen and covenants will tighten. Even so, the credit market remains open and ready to take on risk at the appropriate price.
With widening credit spreads, credit investments should offer more acceptable risk-adjusted returns on capital, gradually shifting the credit outlook we held in 2H26.
Equity Market: History & Now
1987 vs 2026
Stock Market Rally
Between 1982 and 1987, the S&P 500 rose more than 200%. While a weakening U.S. dollar—following the Plaza Accord—helped drive a 27% gain in corporate earnings, most of the market's advance came from valuation expansion rather than fundamental profit growth. Investors priced in excessive optimism, leaving the market vulnerable. When inflation expectations rose, benchmark interest rates climbed, and earnings failed to justify stretched multiples, the imbalance resolved itself abruptly in the October 1987 crash. It stands as a classic reminder of the risks of paying high multiples for modest growth.
In contrast, the last five years’ 77.3% S&P rally from 2021 was backed by genuine fundamental expansion: EPS rose 73.6% (from $208 reported in 2021 to an estimated $361 for 2026). This earnings trajectory was primarily driven by productivity gains that accrued disproportionately to shareholders over labor.
This asymmetry is structurally understandable. Decades of low-cost Asian supply chains expanded gross margins rather than domestic labor income, while financialization amplified these corporate gains. Furthermore, with nearly half of index revenues generated internationally, domestic labor played a limited role in driving foreign sales. Consequently, economic surplus naturally accrued to executive teams and equity shareholders.
The similarity is in the Fed rate hike
In 1987, the Federal Reserve raised interest rates to rein in inflation, which had reached 4%. The resulting monetary tightening—aimed at cooling an economy driven by surging stock prices over the preceding five years and elevated fuel costs—ultimately triggered Black Monday. It was a classic example of monetary policy acting as a catalyst to prick a speculative asset bubble.
By contrast, the rate hikes observed in 2026 reflect a mid-cycle risk-management adjustment rather than a response to generalized economic overheating. Today’s inflationary pressures stem not from excess aggregate demand, but rather from acute structural bottlenecks—most notably in power generation, grid infrastructure renewal, and data centers.
Elevated fuel prices, particularly in middle distillates such as diesel, remain heavily tied to geopolitical frictions around the Strait of Hormuz. These kinetic disruptions are exogenous and likely to reverse. Normalizing energy production and logistics will likely take 12 to 18 months, during which non-Middle Eastern oil-producing nations will take advantage of favorable pricing to sell more crude and distillate. This should cool the energy prices and reduce the need for much higher Fed Funds rates.
Construction and Industrial Goods Inflation
The extraordinary surge in construction across AI data centers, power generation, and grid infrastructure represents a genuine technological cycle, but it also highlights a failure of long-term policy planning. Regardless of the upcoming midterm election results, capital expenditure commitments for power and AI infrastructure through 2027 and 2028 are largely locked in. Because the primary bottleneck is structural supply constraints rather than cyclical demand, higher interest rates alone are unlikely to cool this price pressure in the near term.
So long as compute demand remains insatiable, we expect hyperscalers and enterprises to announce further capital expenditure expansions into 2027.
This sustained investment should support broader economic activity and consumer demand, though it simultaneously reinforces persistent underlying cost pressures.
Will demand be misjudged like 2000 and 2022
Unlike the 2022 demand cliff that sent the tech market into a downward spiral following second-quarter results, the current AI buildout represents an industrial-scale revolution rather than a consumer-driven shift. In 2022, consumer spending briefly pivoted during lockdown psychological relief toward online shopping before transitioning back to experience-oriented consumption once lockdowns ended.
Nor is it like the early 2000s, when the dot-com and telecom fiber-optic buildouts were driven by inflated revenue projections, high leverage, and speculative valuations unsupported by earnings.
Today, the environment is fundamentally different. Data centers are constructed based on pre-contracted demand backed by validated financial capacity required by lenders. The buildouts are time-consuming, while demand surges are instantaneous in each innovative iteration refresh, which comes fast and furious. Current compute demand is primarily driven by:
AI Agents: A standard research task executed by AI agents now requires 150,000 to 500,000 tokens within an expanded context window, compared to 1,000 to 2,000 tokens for early single-response chatbots, resulting in an exponential surge in compute demand; and
Enterprise Adoption: Exponential growth in adoption as enterprises accelerate deployment to maintain competitiveness, an enterprise FOMO moment.
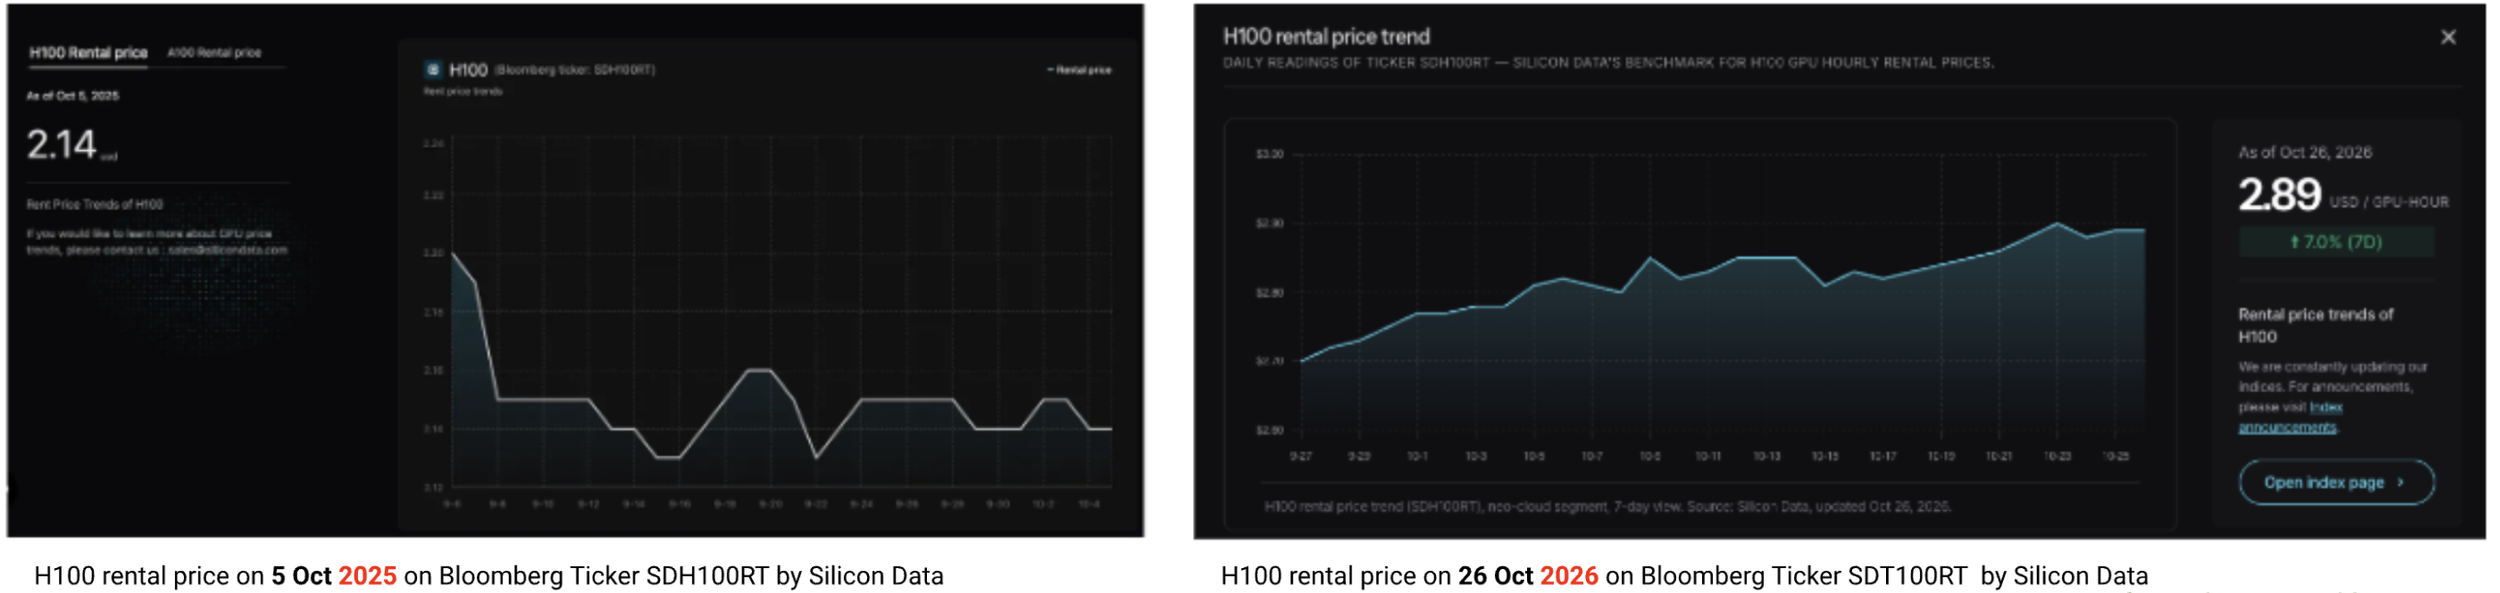
Supporting this thesis, rental prices for older 2023-vintage H100 GPUs have risen year-over-year to over $2.80 per hour, confirming that insatiable demand continues to outpace supply.
While residential real estate development is weak on high mortgage rates, data center and power infrastructure construction is expanding to fill the gap. The broader economic impact differs significantly from consumer discretionary and durables. Industrial goods, engineering equipment, servers, turbines etc are experiencing heightened demand, alongside specialized construction labor. This sustained activity will maintain upward pressure on capital equipment costs and skilled wages over the next few years.
If you entertain a sustained fall in long-term interest rates to 4%, mortgage borrowing will be conducive to driving residential real estate, which will be another source of inflation to overheat the construction sector. The follow-on consumption of durable and discretionary purchases will further heat up the economy.
Hence, with a strong economy and unstable price conditions, it would be hard to contemplate central banks backing down on tighter monetary policies. While Chairman Warsh may anticipate that elevated bond yields, softer equity markets, and surging energy prices will sufficiently tighten financial conditions to temper aggregate demand, we maintain that monetary policy remains ill-suited to address the structural drivers of energy-led inflation. Consequently, transitioning back to an accommodative monetary stance—aimed at satisfying political pressures without forfeiting market credibility—presents a formidable challenge. Ultimately, resolving these underlying inflationary dynamics lies beyond the purview of the Federal Reserve Chair and resides squarely within the authority of the White House to end the war in Iran.
AI Landscape
National Political Football
In the aftermath of the midterm elections, both major political parties are expected to rapidly redirect their focus toward the 2028 Presidential contest.
Intensifying political polarization and NIMBY-driven debates between Republicans and Democrats are likely to add significant friction to site approval processes, delay construction schedules, and threaten to constrain new supply in a market already bound by token scarcity.
If token growth falls short of peak targets, a slower expansion of AI infrastructure would ripple across the entire AI supply chain, disrupting both upstream suppliers and downstream providers and invalidating much of the current baseline projections.
In this constrained regime, well-capitalized mega-cap technology corporations are positioned to consolidate power, while independent market participants outside interconnected cross-holding AI networks face severe vulnerability. We will complete a full assessment of these long-term structural implications after the election results.
This realignment will inevitably introduce macro headwinds and create widespread second- and third-order ripple effects across the domestic U.S. economy and the broader Asian supply chain ecosystem.
AI Adoption Return Remains the Prime Question
CEOs are shifting from token-maxing adoption with loosely defined use cases to concrete mission objectives, return metrics from AI spending, and realized efficiency gains from AI integration. In the recent earnings report, several CEOs have expressed increasingly constructive notes on AI adoption and investment:
Bank of America: CEO Brian Moynihan highlighted that an initial $400 million investment across 130 to 140 discrete AI initiatives has yielded $800 million in quantifiable economic value, prompting plans to double the firm's AI capital budget next year. The bank's virtual assistant, Erica, expanded its active user base to 24.6 million in 2Q26. According to Chief Technology and Information Officer Hari Gopalkrishnan, maintaining equivalent service capacity without Erica would require an additional 11,000 headcount. Furthermore, EricaAssist—deployed across more than 18,000 customer service representatives—has reduced average call handling times by nearly one minute.
Société Générale projects AI implementations to account for up to $669 million of its targeted $2.1 billion in cost reductions by 2029.
Commerzbank anticipates approximately €557 million in annualized structural value starting in 2030.
We continue to monitor the trajectory of enterprise adoption. To date, implementation has centered largely on front-office client servicing and workflow automation. However, ongoing channel checks across industrial engineering and biotechnology sectors suggest accelerating integration within core R&D functions—specifically via digital twin modeling, predictive simulation, and testing—which significantly compresses historical development timelines and capital intensity.
AI Human Interaction
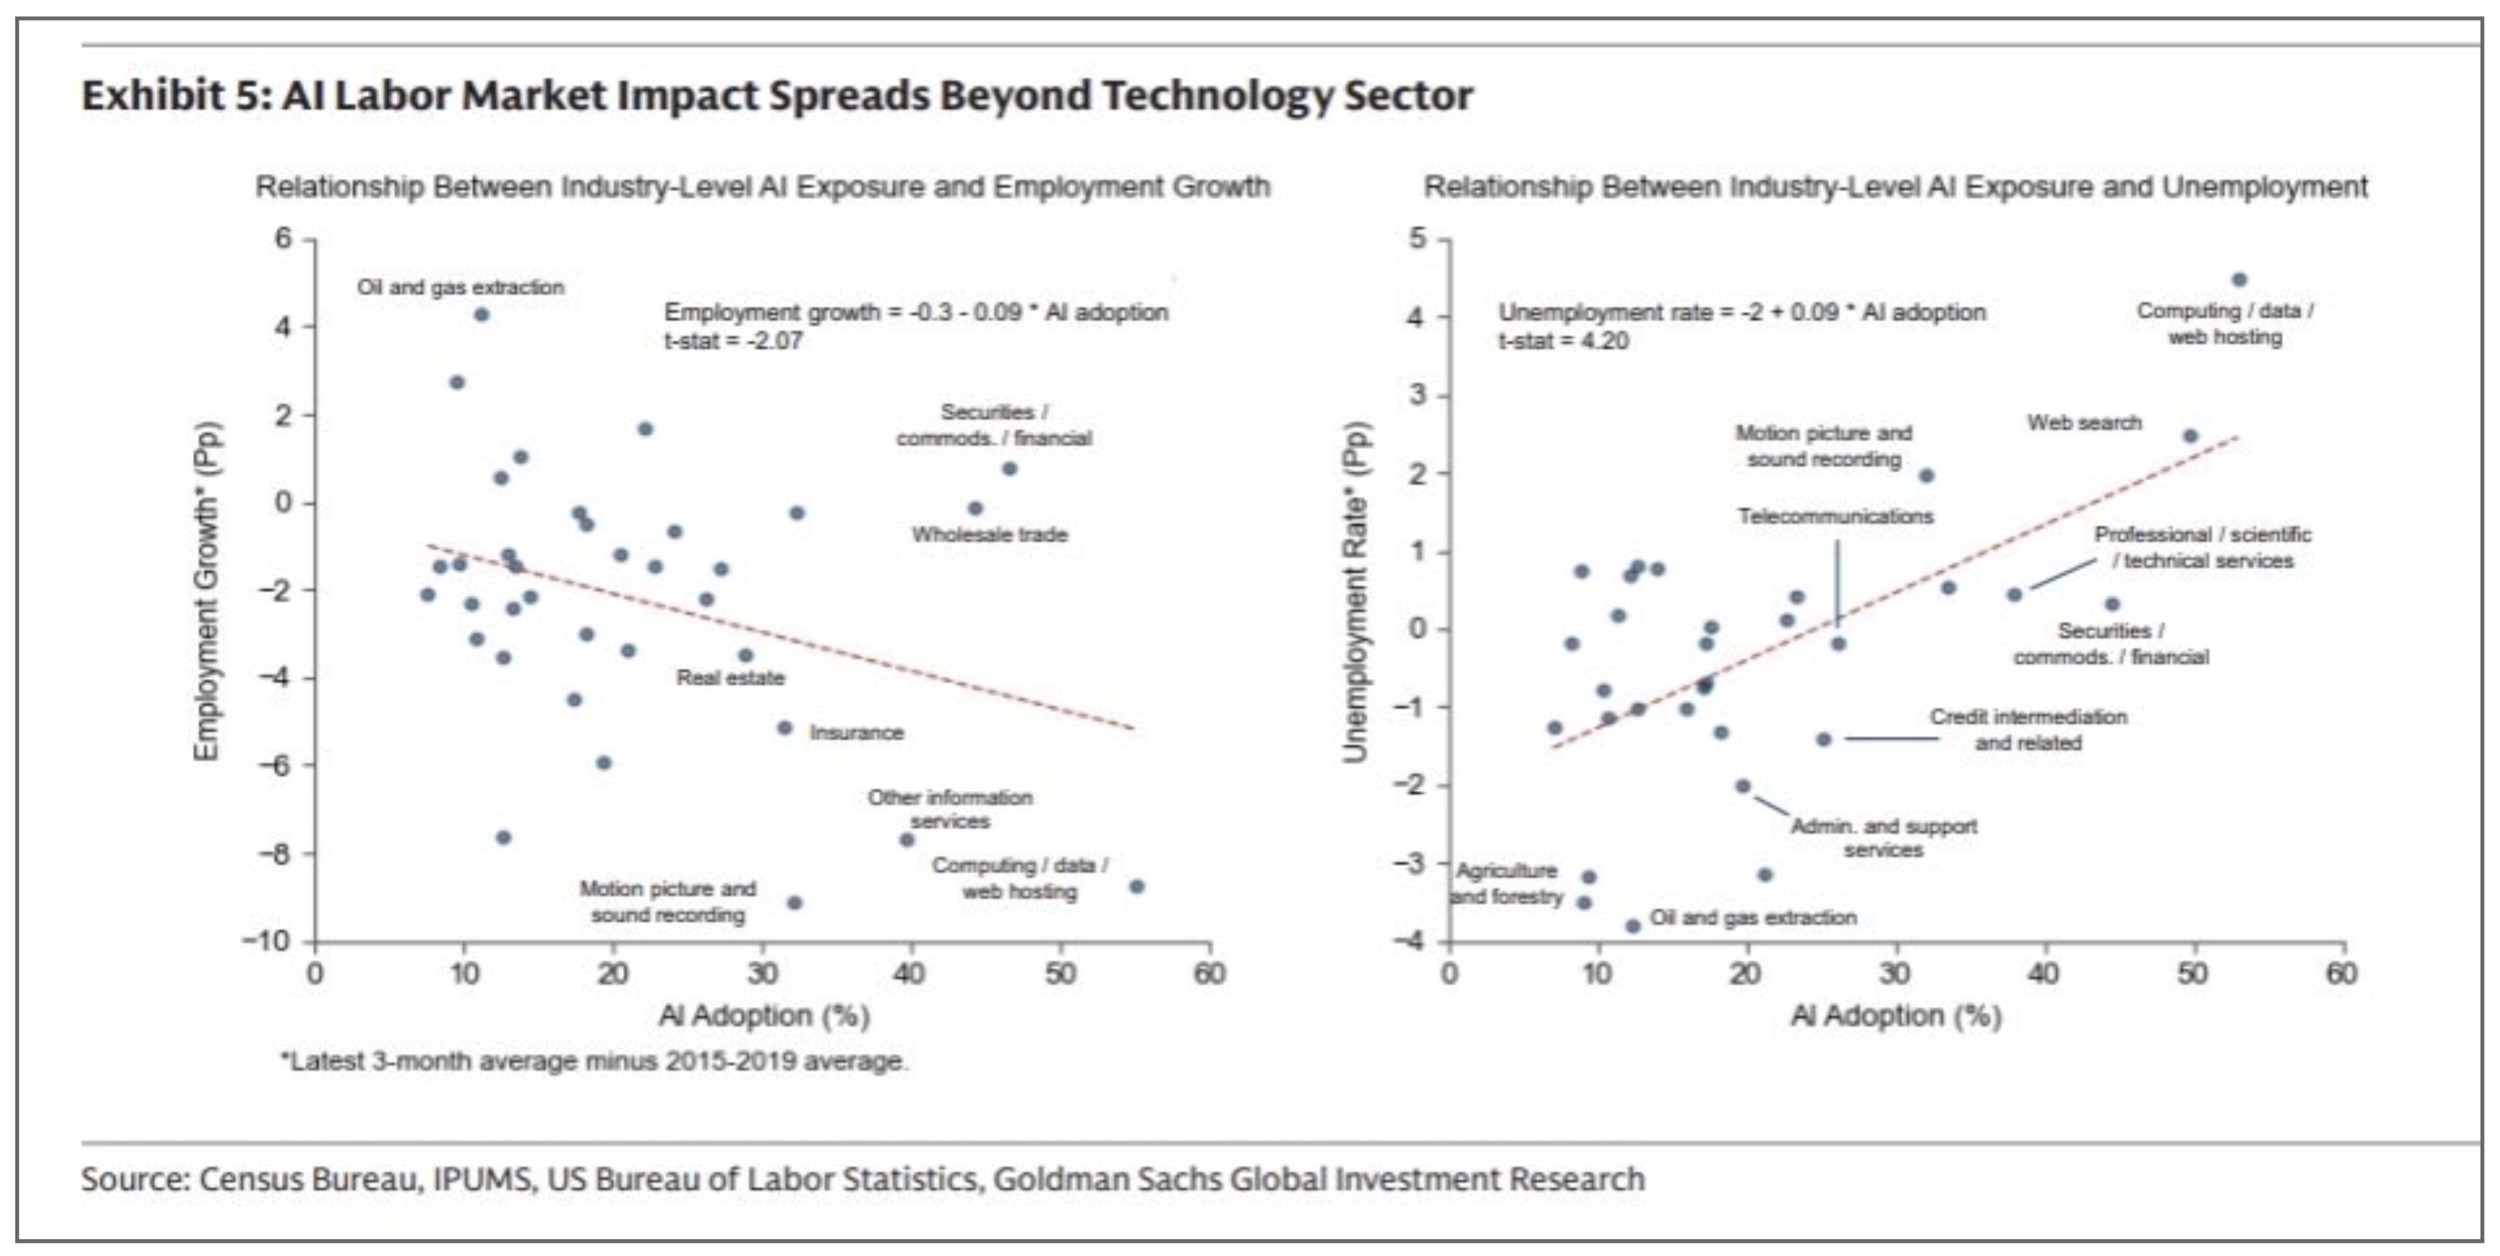
The US Census Bureau, IMUMS, the Bureau of Labor Statistics, and Goldman Sachs Global Investment Research recently released a chart examining hiring and unemployment rates across industries. The conclusion is self-explanatory: The more AI adoption in a white collar industry, the lower its employment growth and higher the unemployment rate.
Hence, it is crucial to remember that Alongside these investment opportunities come profound societal implications, as nations and communities unprepared for this transition are likely to experience heightened social unrest.
China Outlook
Consumer Psychology vs Health
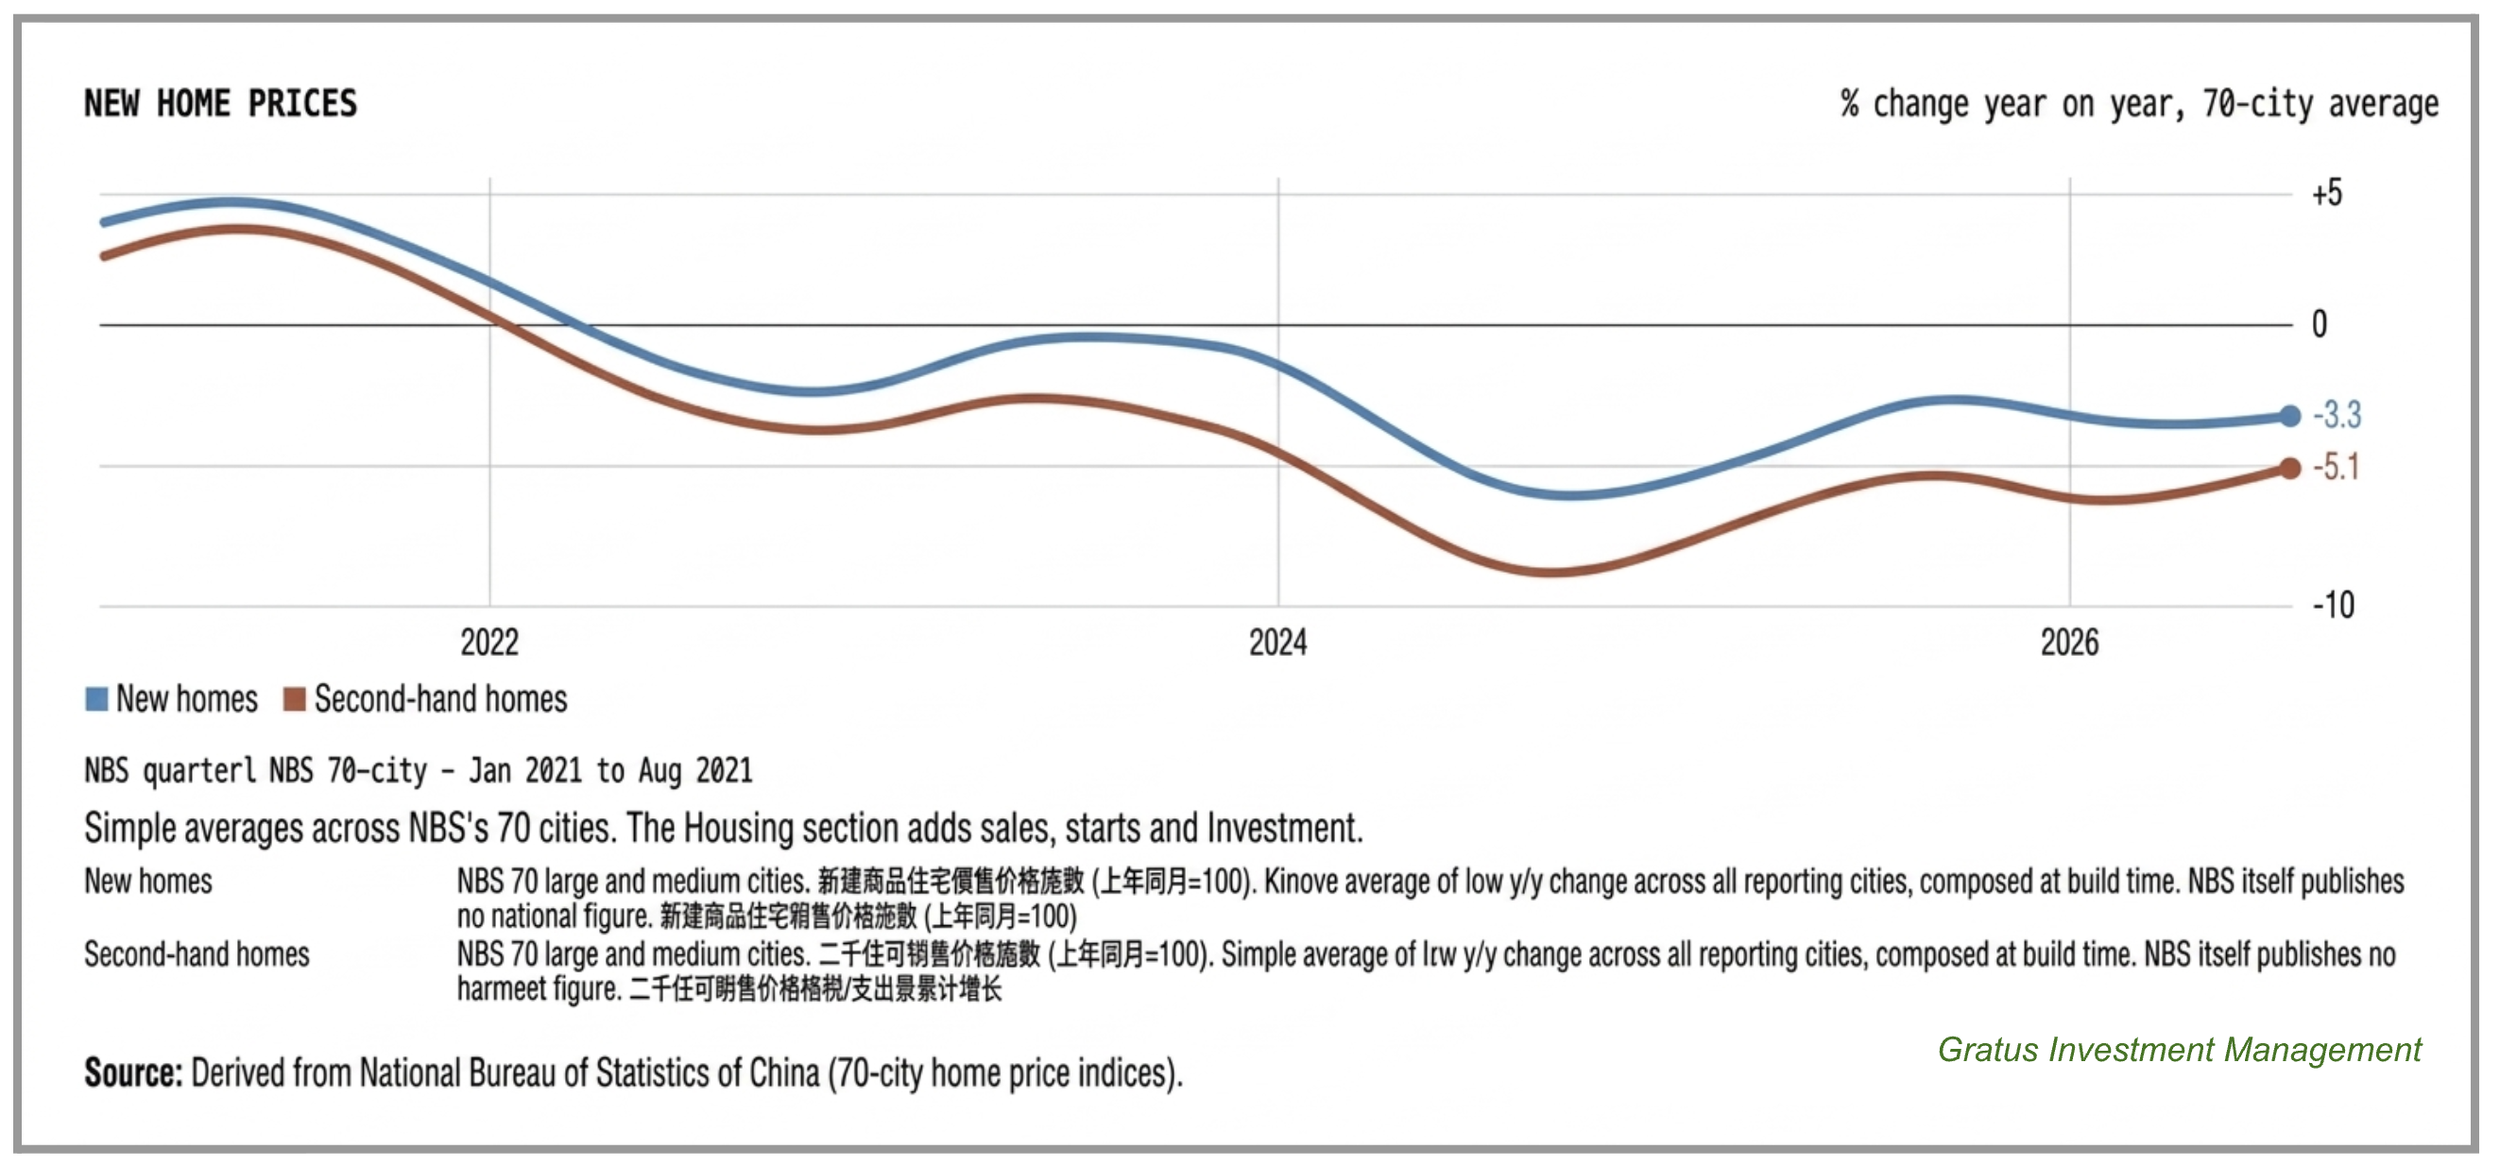
Consumer sentiment in China remains heavily burdened by real estate prices and broader economic uncertainty.
Recent data points to an initial stabilization in the real estate market, marked by selective rebounds in Tier-1 cities where new home transactions rose 43.3%, and pre-owned property sales climbed 19.2%. While underlying residential demand is more restrained following recent traumatic experience, market conditions are finding a firmer footing, reducing the likelihood of further deterioration in the near term.
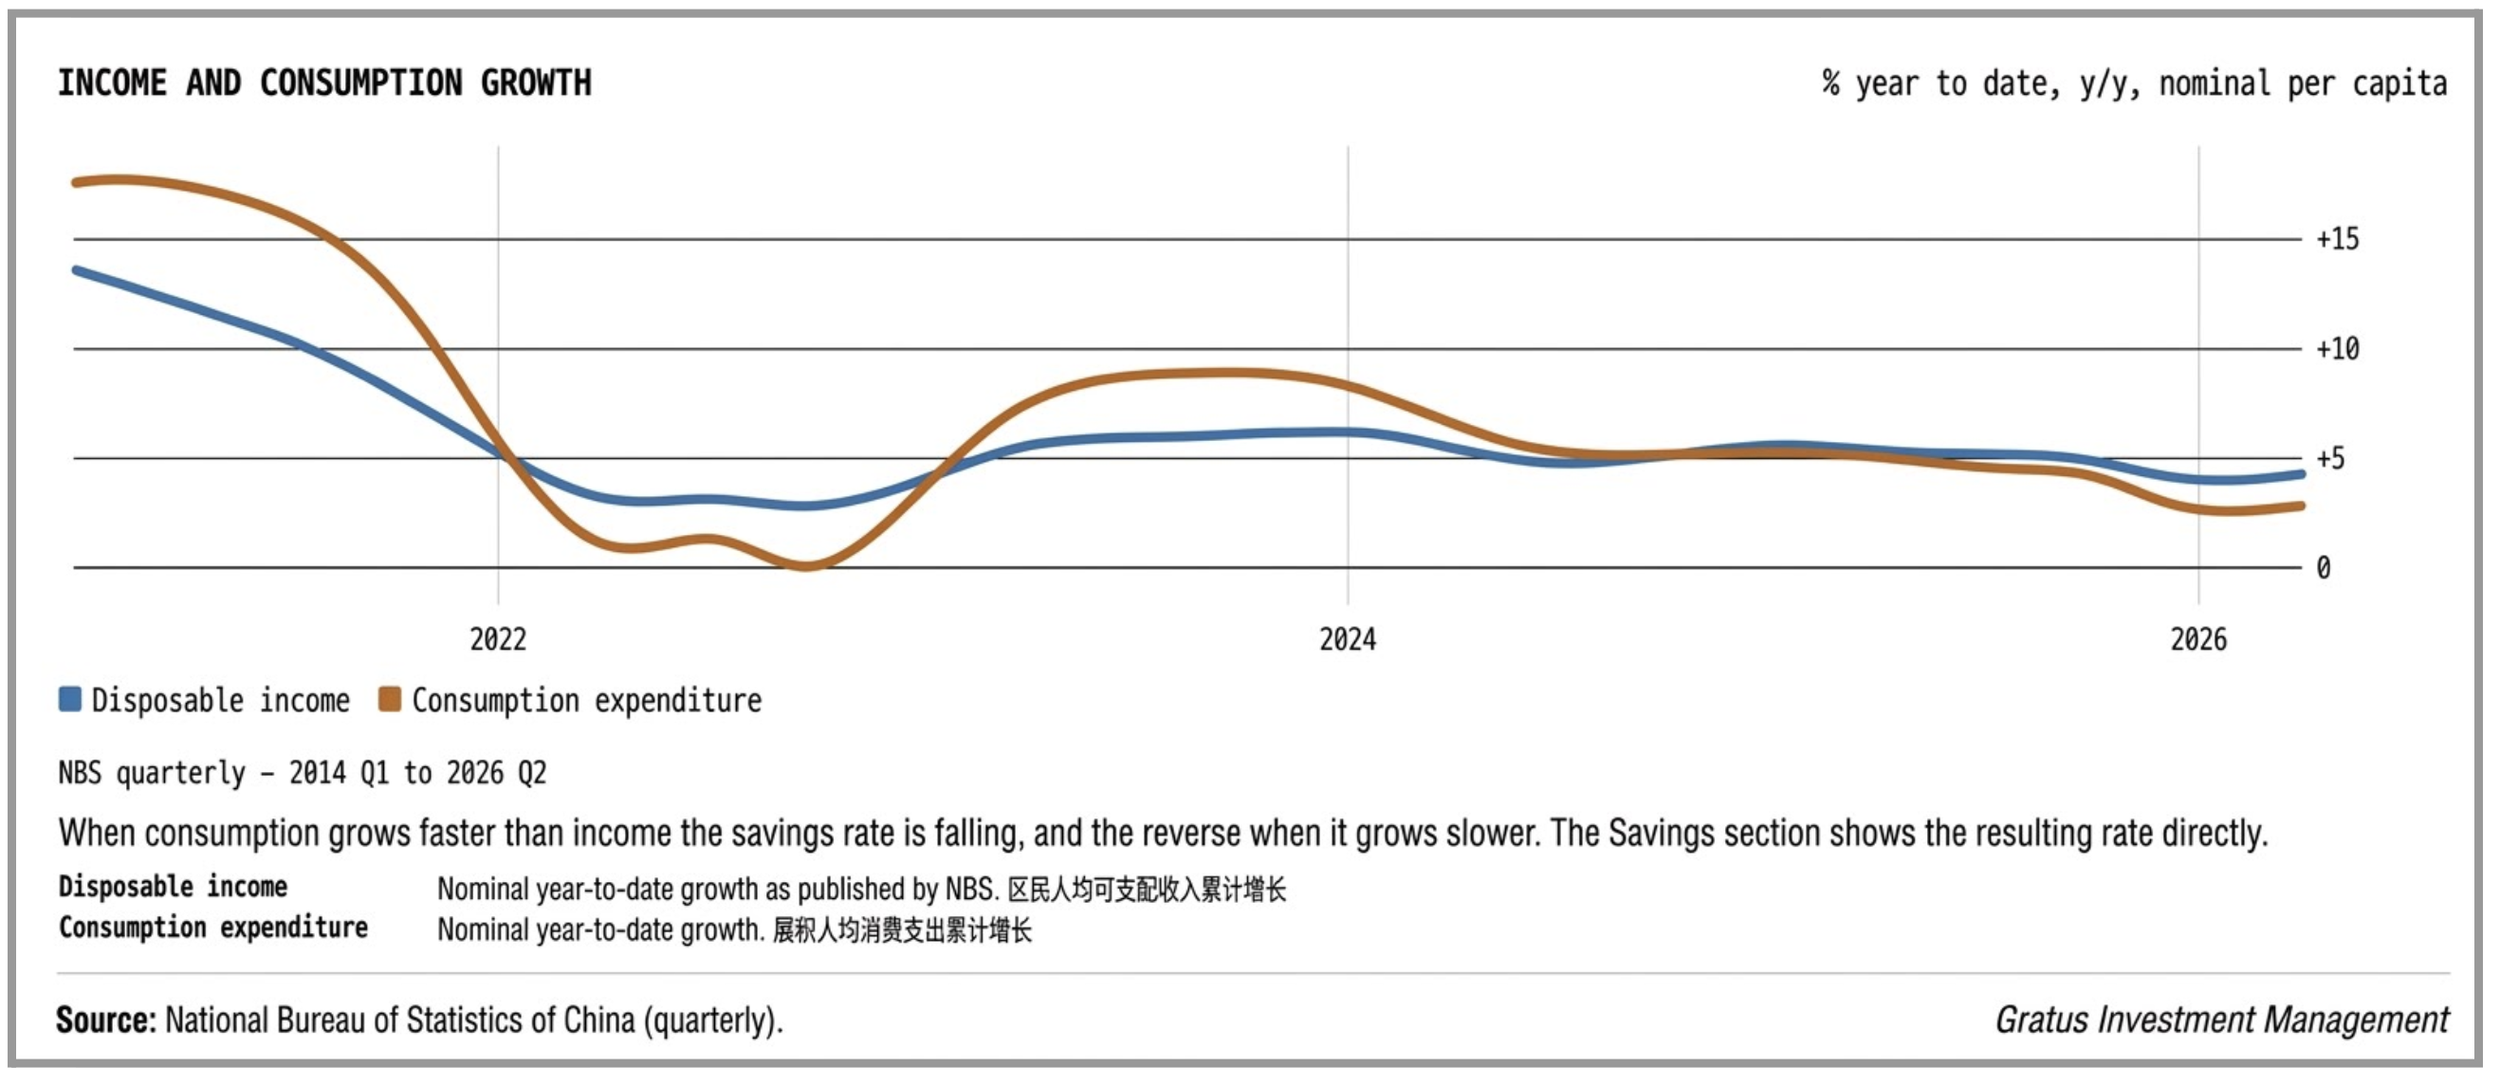
While disposable income has steadily grown, consumer spending remains constrained despite subdued inflation. Notably, an elevated PPI has failed to feed through into higher consumer prices.
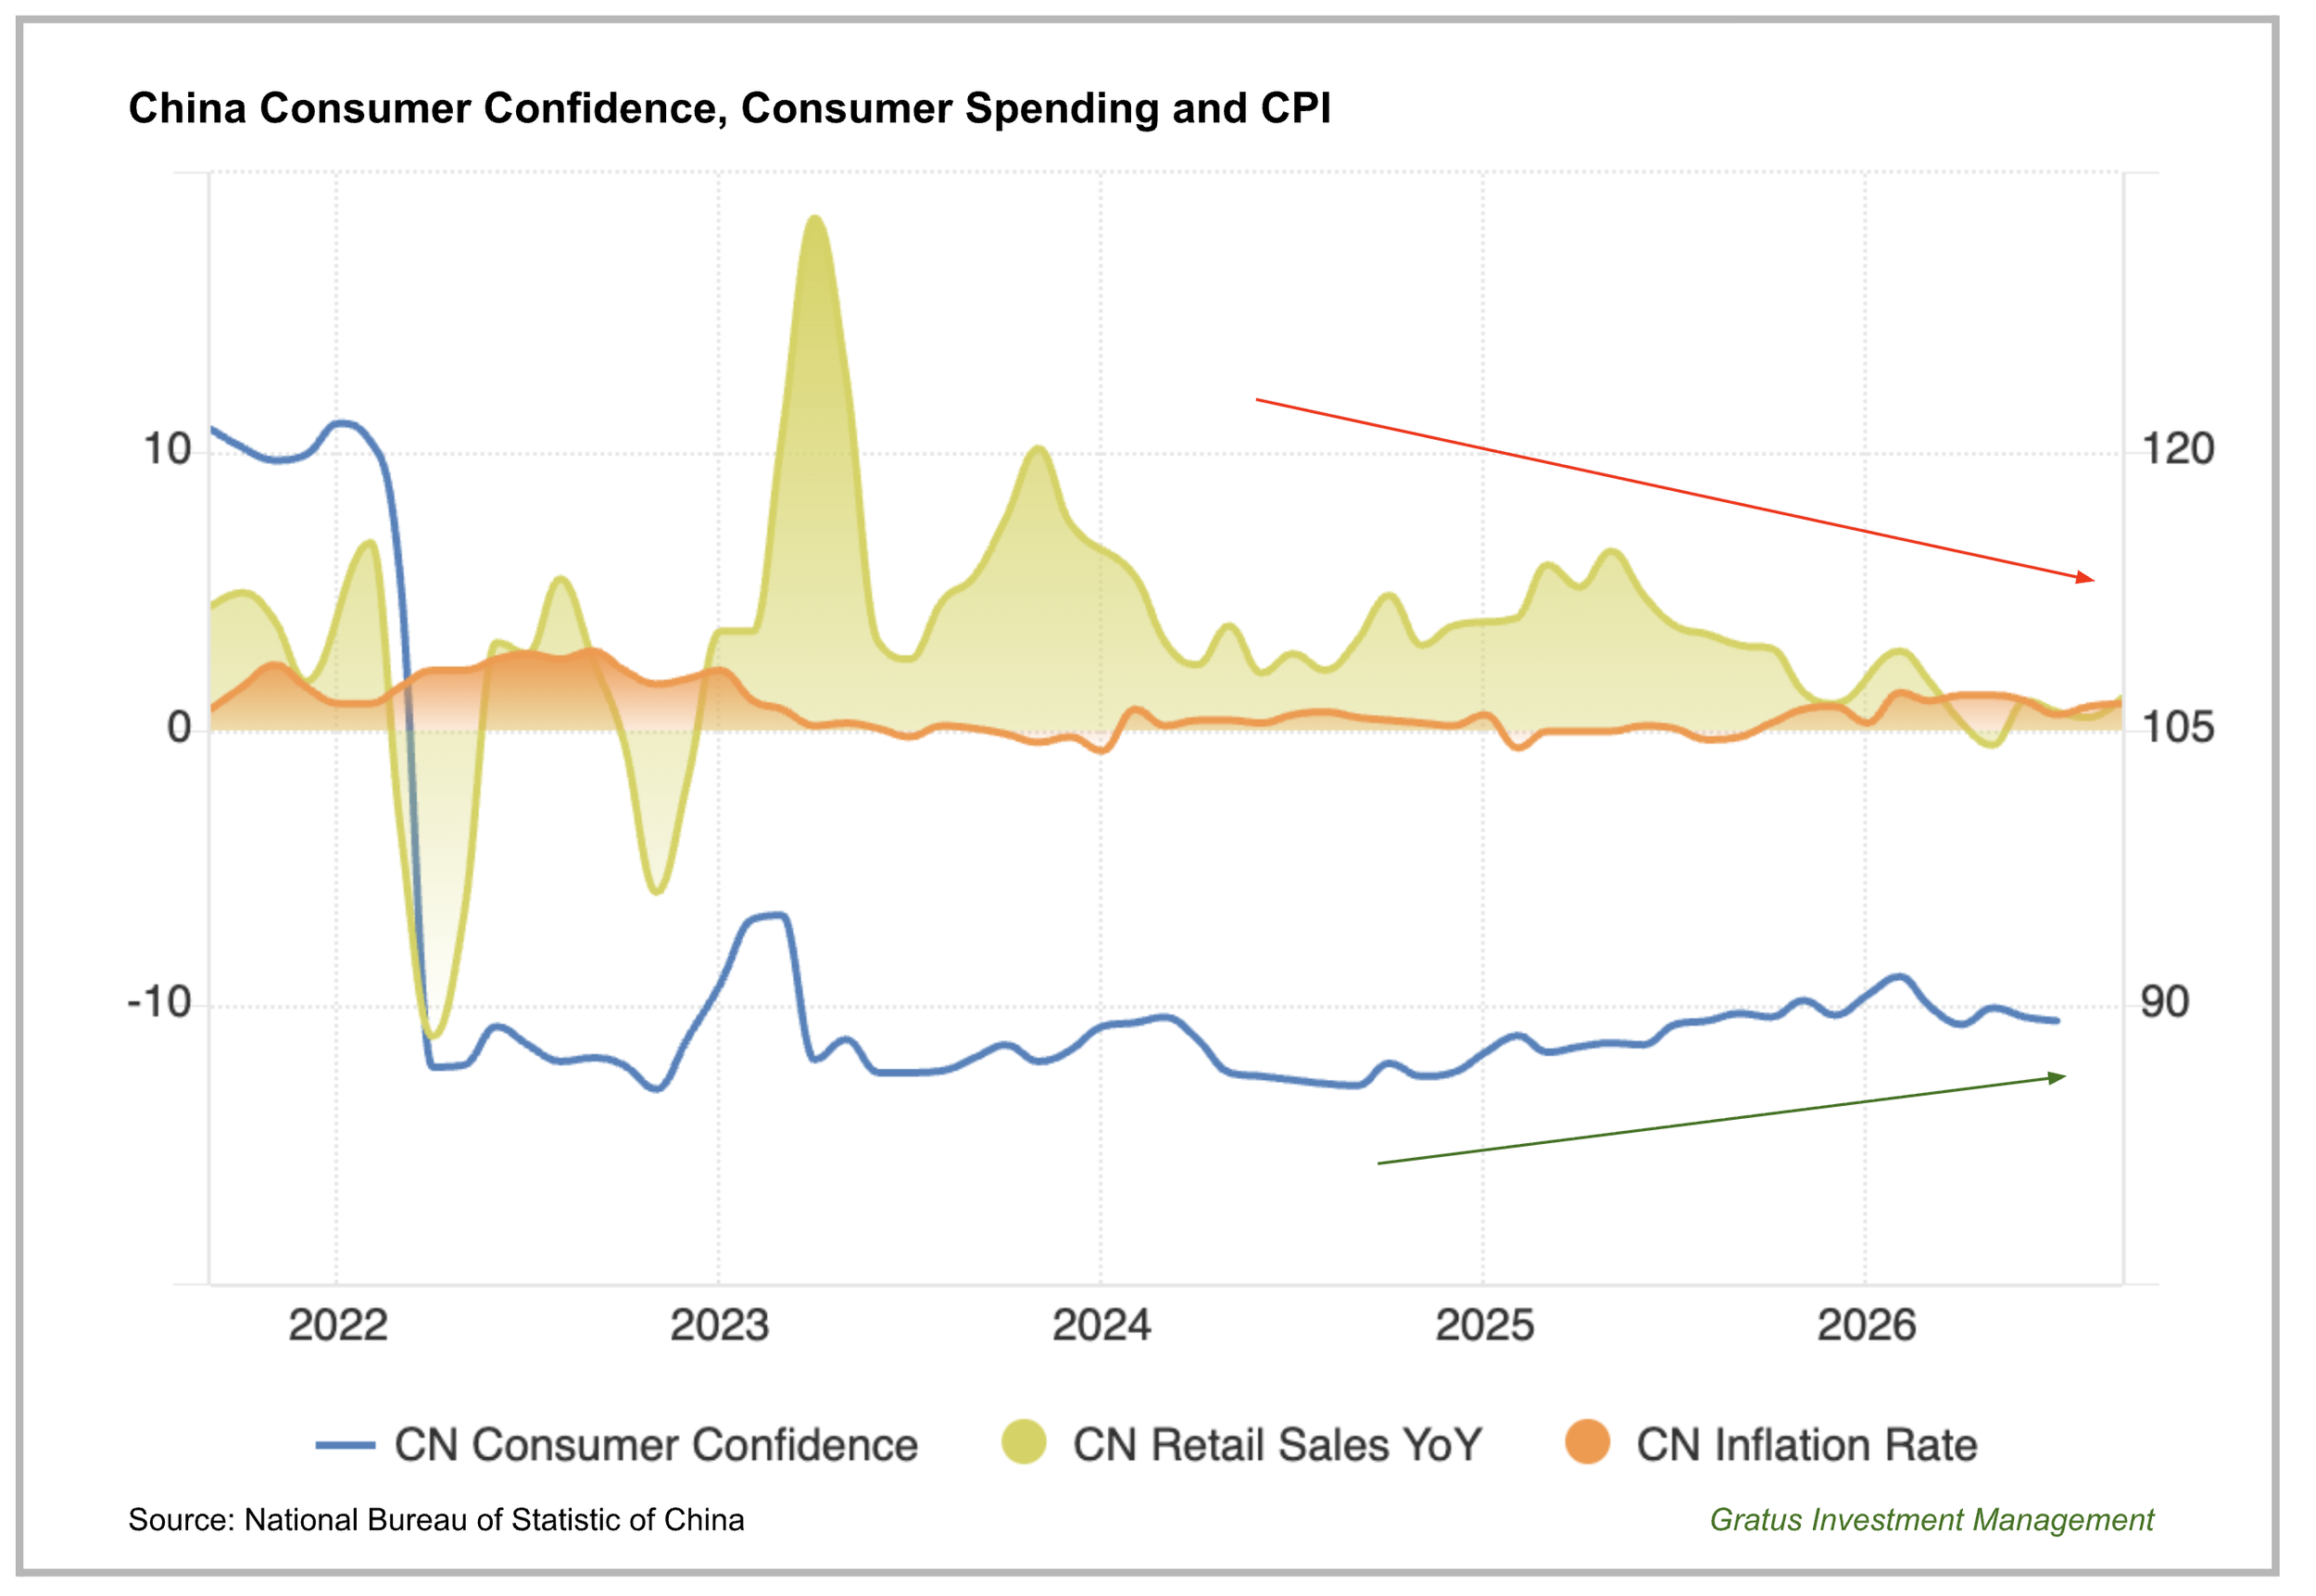
In early 2022, rising Inflation (orange area) and tumbling consumer confidence (blue line), driven by more stringent lockdown conditions and a real estate slump, slowed consumer spending dramatically (yellowish area). The reopening in December 2022 sparked a new wave of excitement and improved consumer confidence, which led to a surge in consumer spending, but it was short-lived. It has remained in a doldrum since 2024, and it has begun to trend up. While official data has not shown a notable change in trend, high-frequency data is showing signs.
Signs are emerging that the trend is shifting, as evidenced by mixed indicators from the recent October National Day holiday. Domestic trip volume expanded 6.3% year-over-year, yet overall spending grew by a more modest 4.3%. Air travel grew marginally by 1.2%, while high fuel costs discouraged driving. Travelers favored rail for intercity journeys because fares remained unchanged.
This indicates that although consumer sentiment is turning and consumers are more willing to travel, households remain distinctly prudent. On the other hand, the slower spending rate could also reflect slower consumer price normalization, as low-cost inventory remains high. As you will see on the next page, rising factory-floor prices should transmit through the Chinese New Year holiday.
Inflection point for PPI
The Chinese government has issued explicit directives targeting destructive price wars among domestic firms in both home and cross-border arenas in July 2025 and implemented them later that year. These policy mandates aim to redirect corporate priorities toward technology, innovation, and operational efficiency, rather than chasing market share through aggressive price wars. Following initial regulatory frameworks introduced in late 2025, three state officials, including MOFCOM, MIIT, and SAMR, published expanded compliance measures in September 2026 to govern global market conduct.
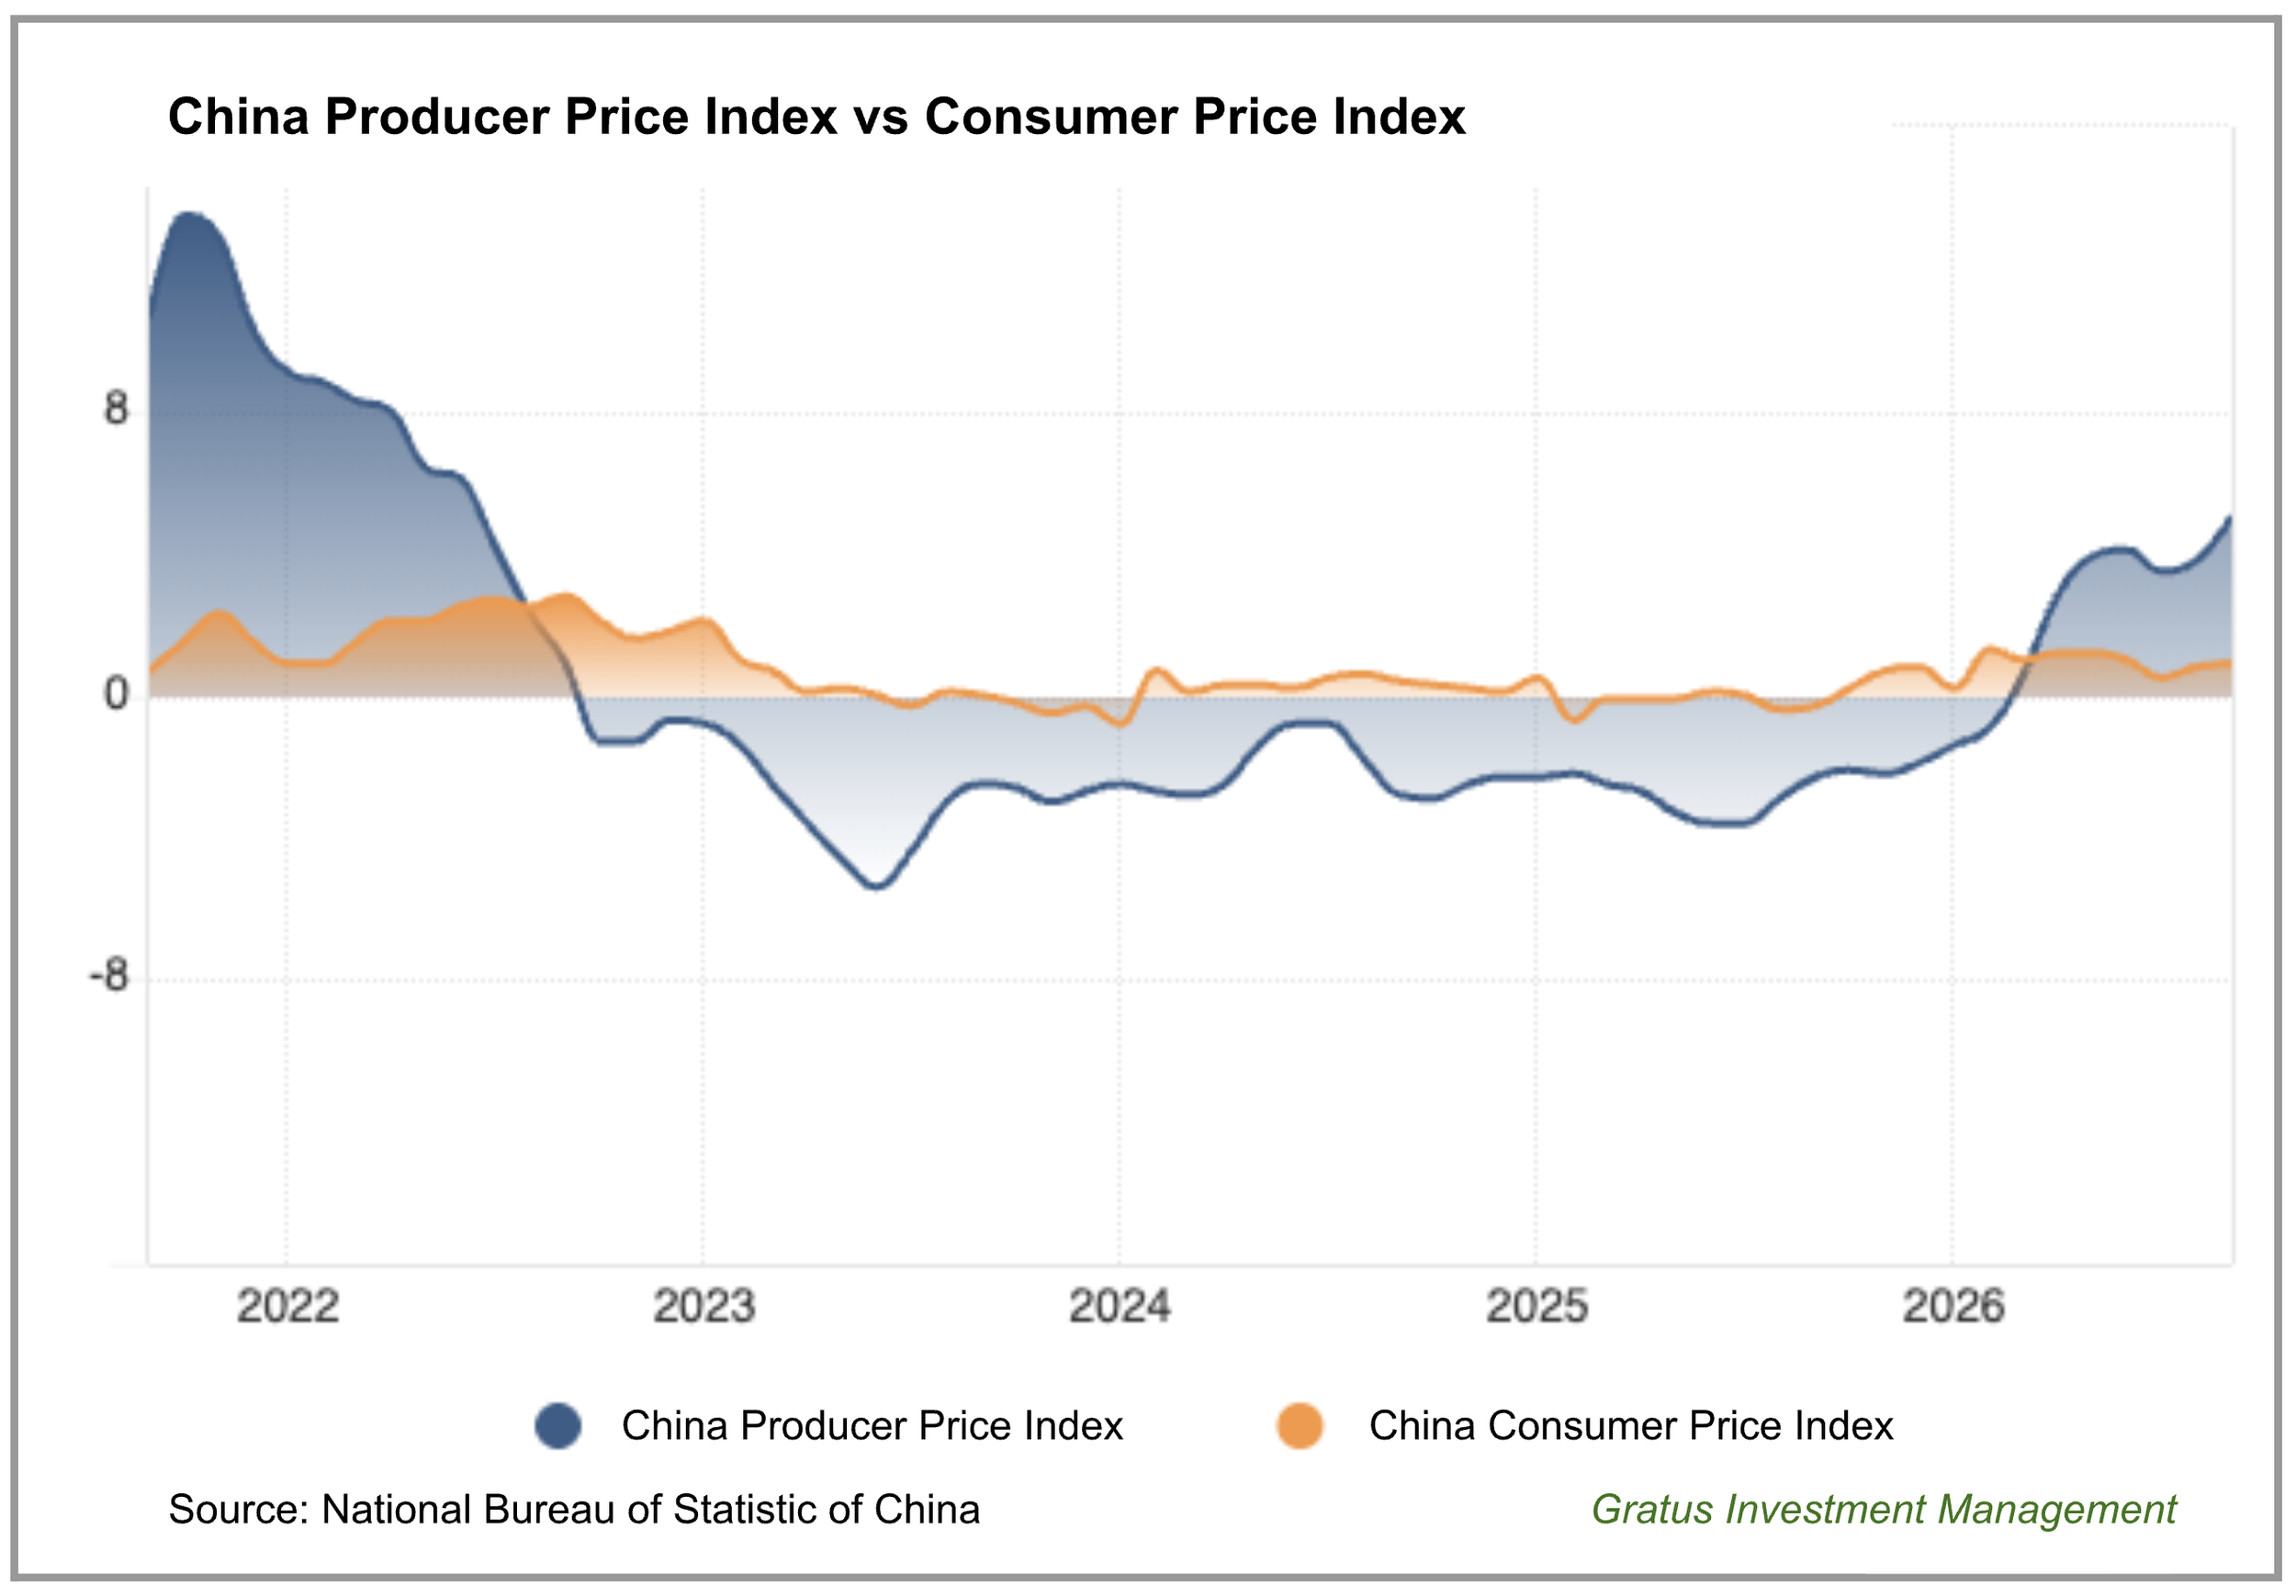
In response, enterprises have moved to stabilize their pricing strategy. Producer price indexes hit a low in July 2025 before entering a sustained upward trajectory, gaining momentum in April 2026 amid escalating input energy costs driven by the US/Israel war in Iran. This reflationary trend shows little sign of abating.
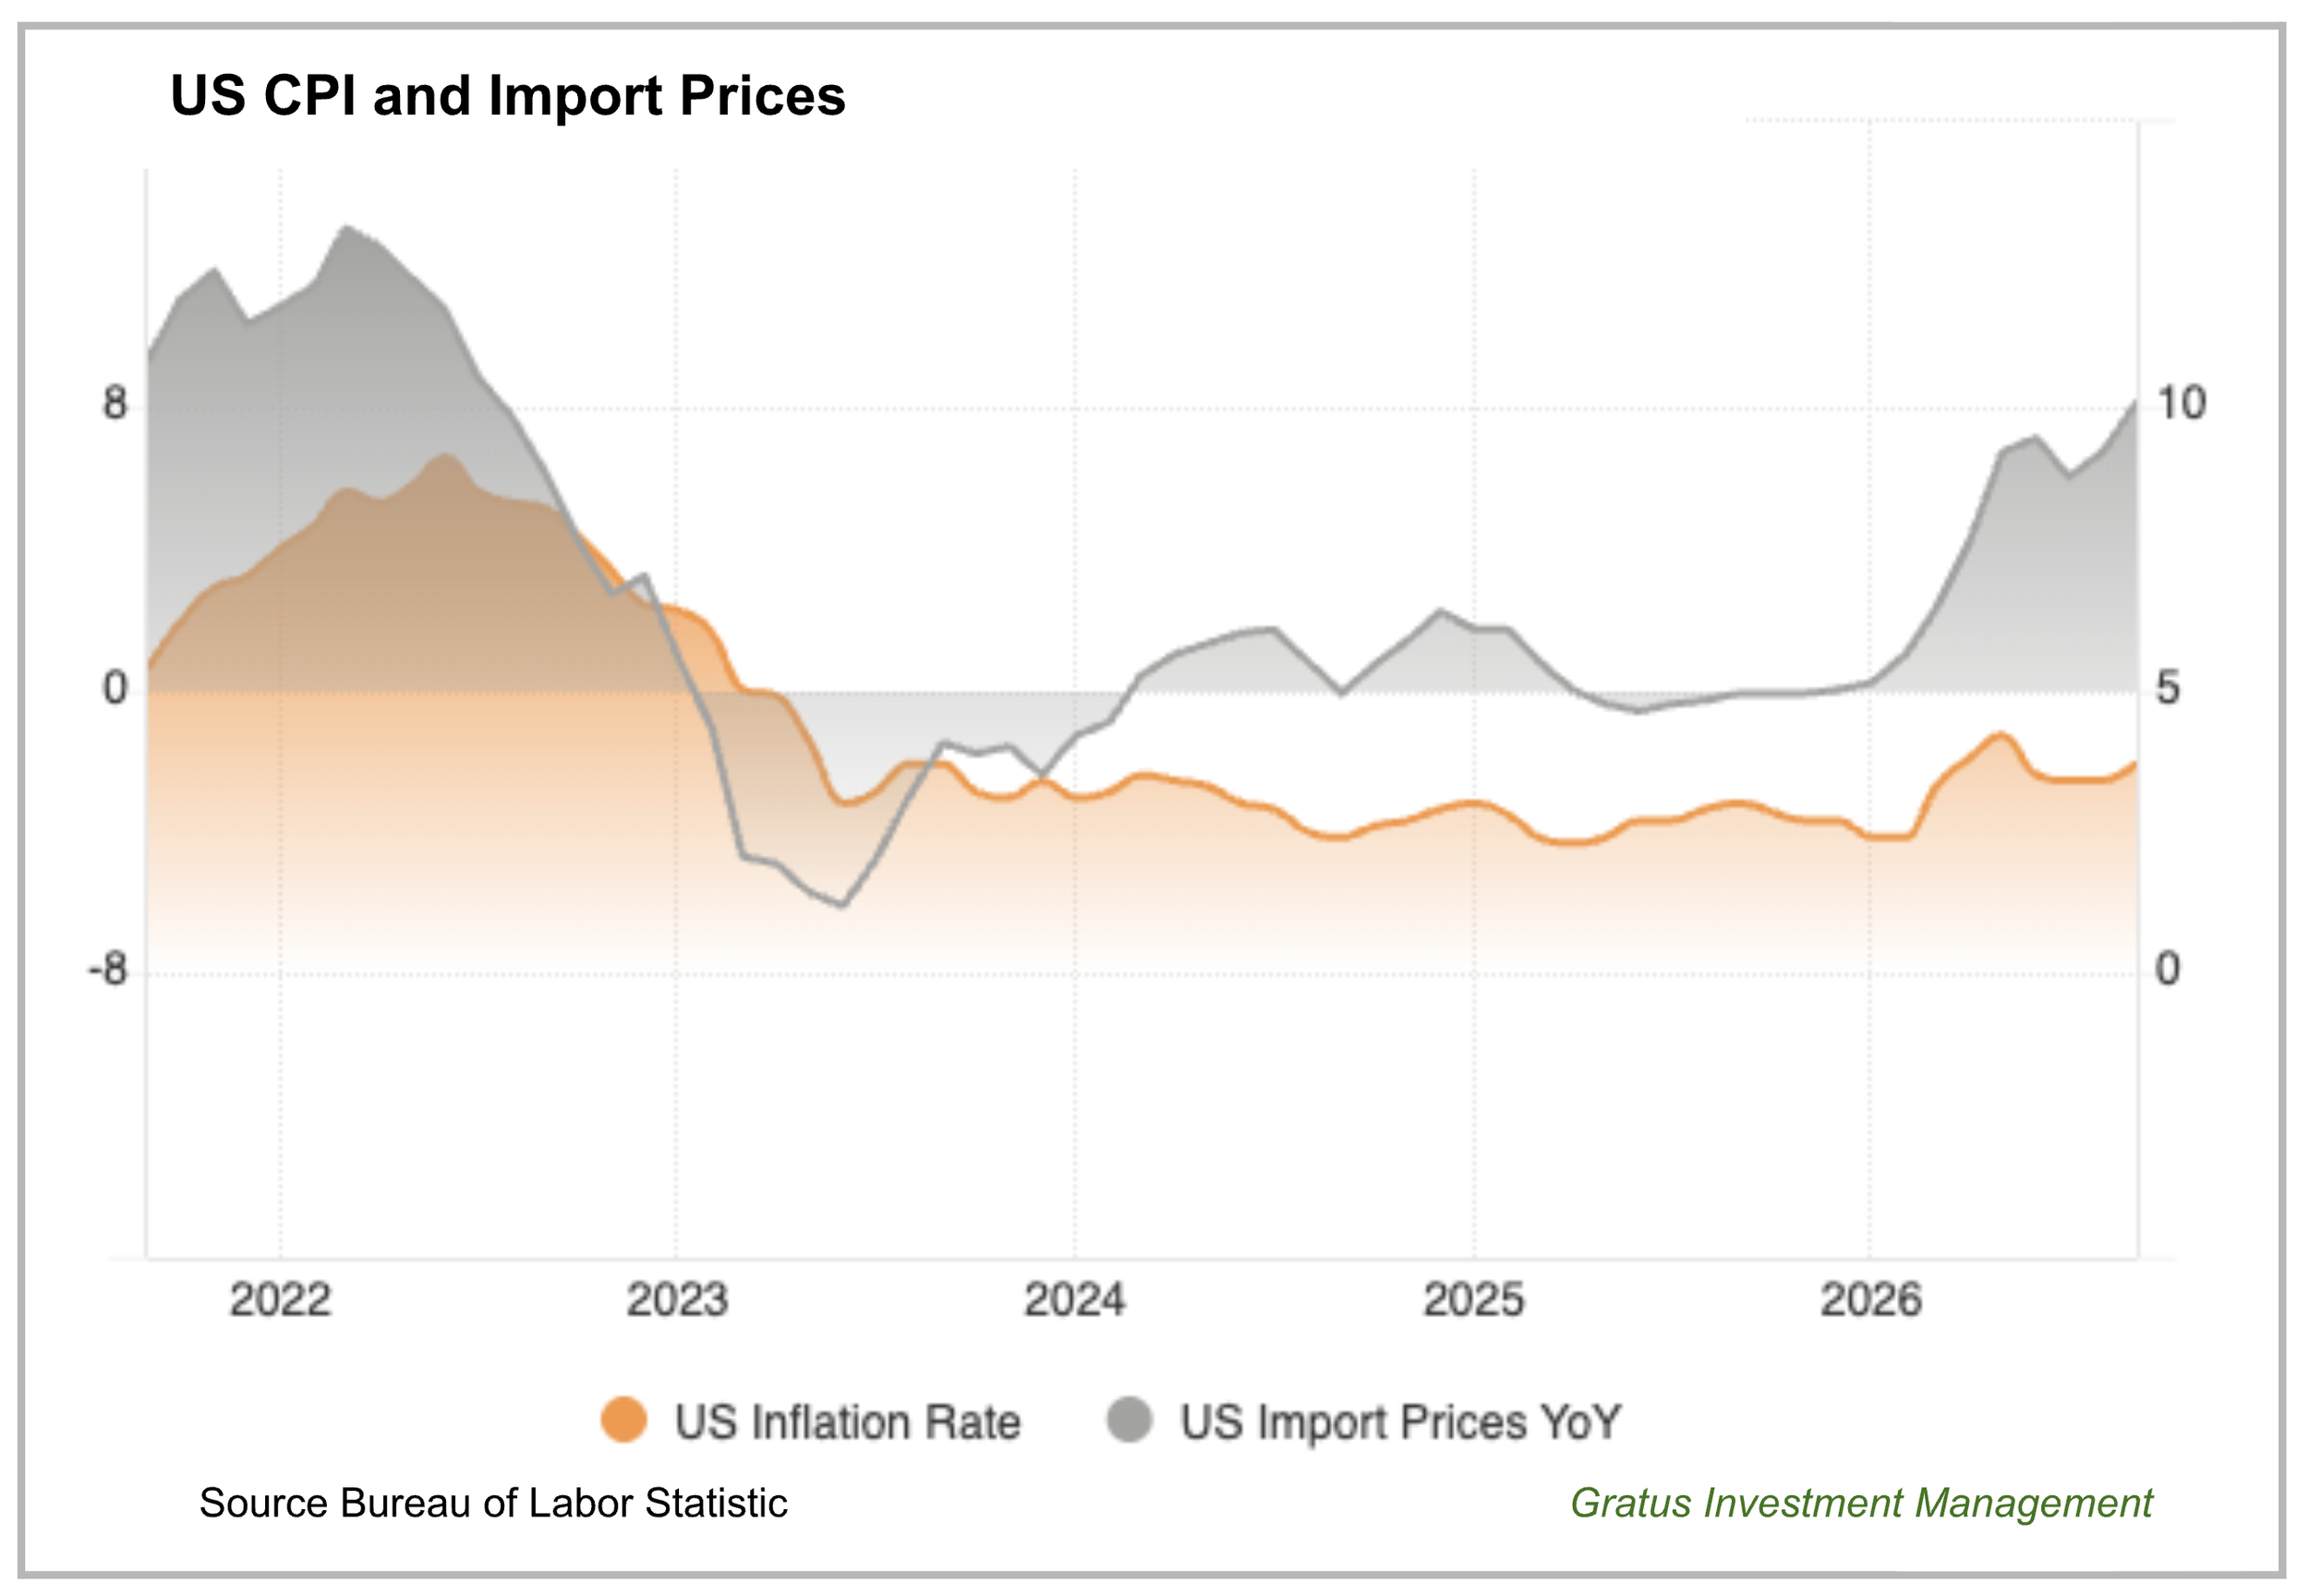
As Chinese factory gate prices fell sharply after 2022, international import prices fell as well, following a similar trajectory. U.S. import prices bottomed at -6.0% in mid-2023. That disinflationary environment has since reversed course; independent of trade tariffs, rising landing costs began climbing toward late 2025, accelerating by March 2026 and increasingly feeding into broader consumer inflation.
The Feedthrough - Corporate Earnings Bonanza
Profits at onshore-listed Chinese companies surged 25.7% year over year in the second quarter of 2026, marking the fastest corporate earnings growth in nearly five years. Conversely, MSCI China earnings were up about 5% year-on-year.
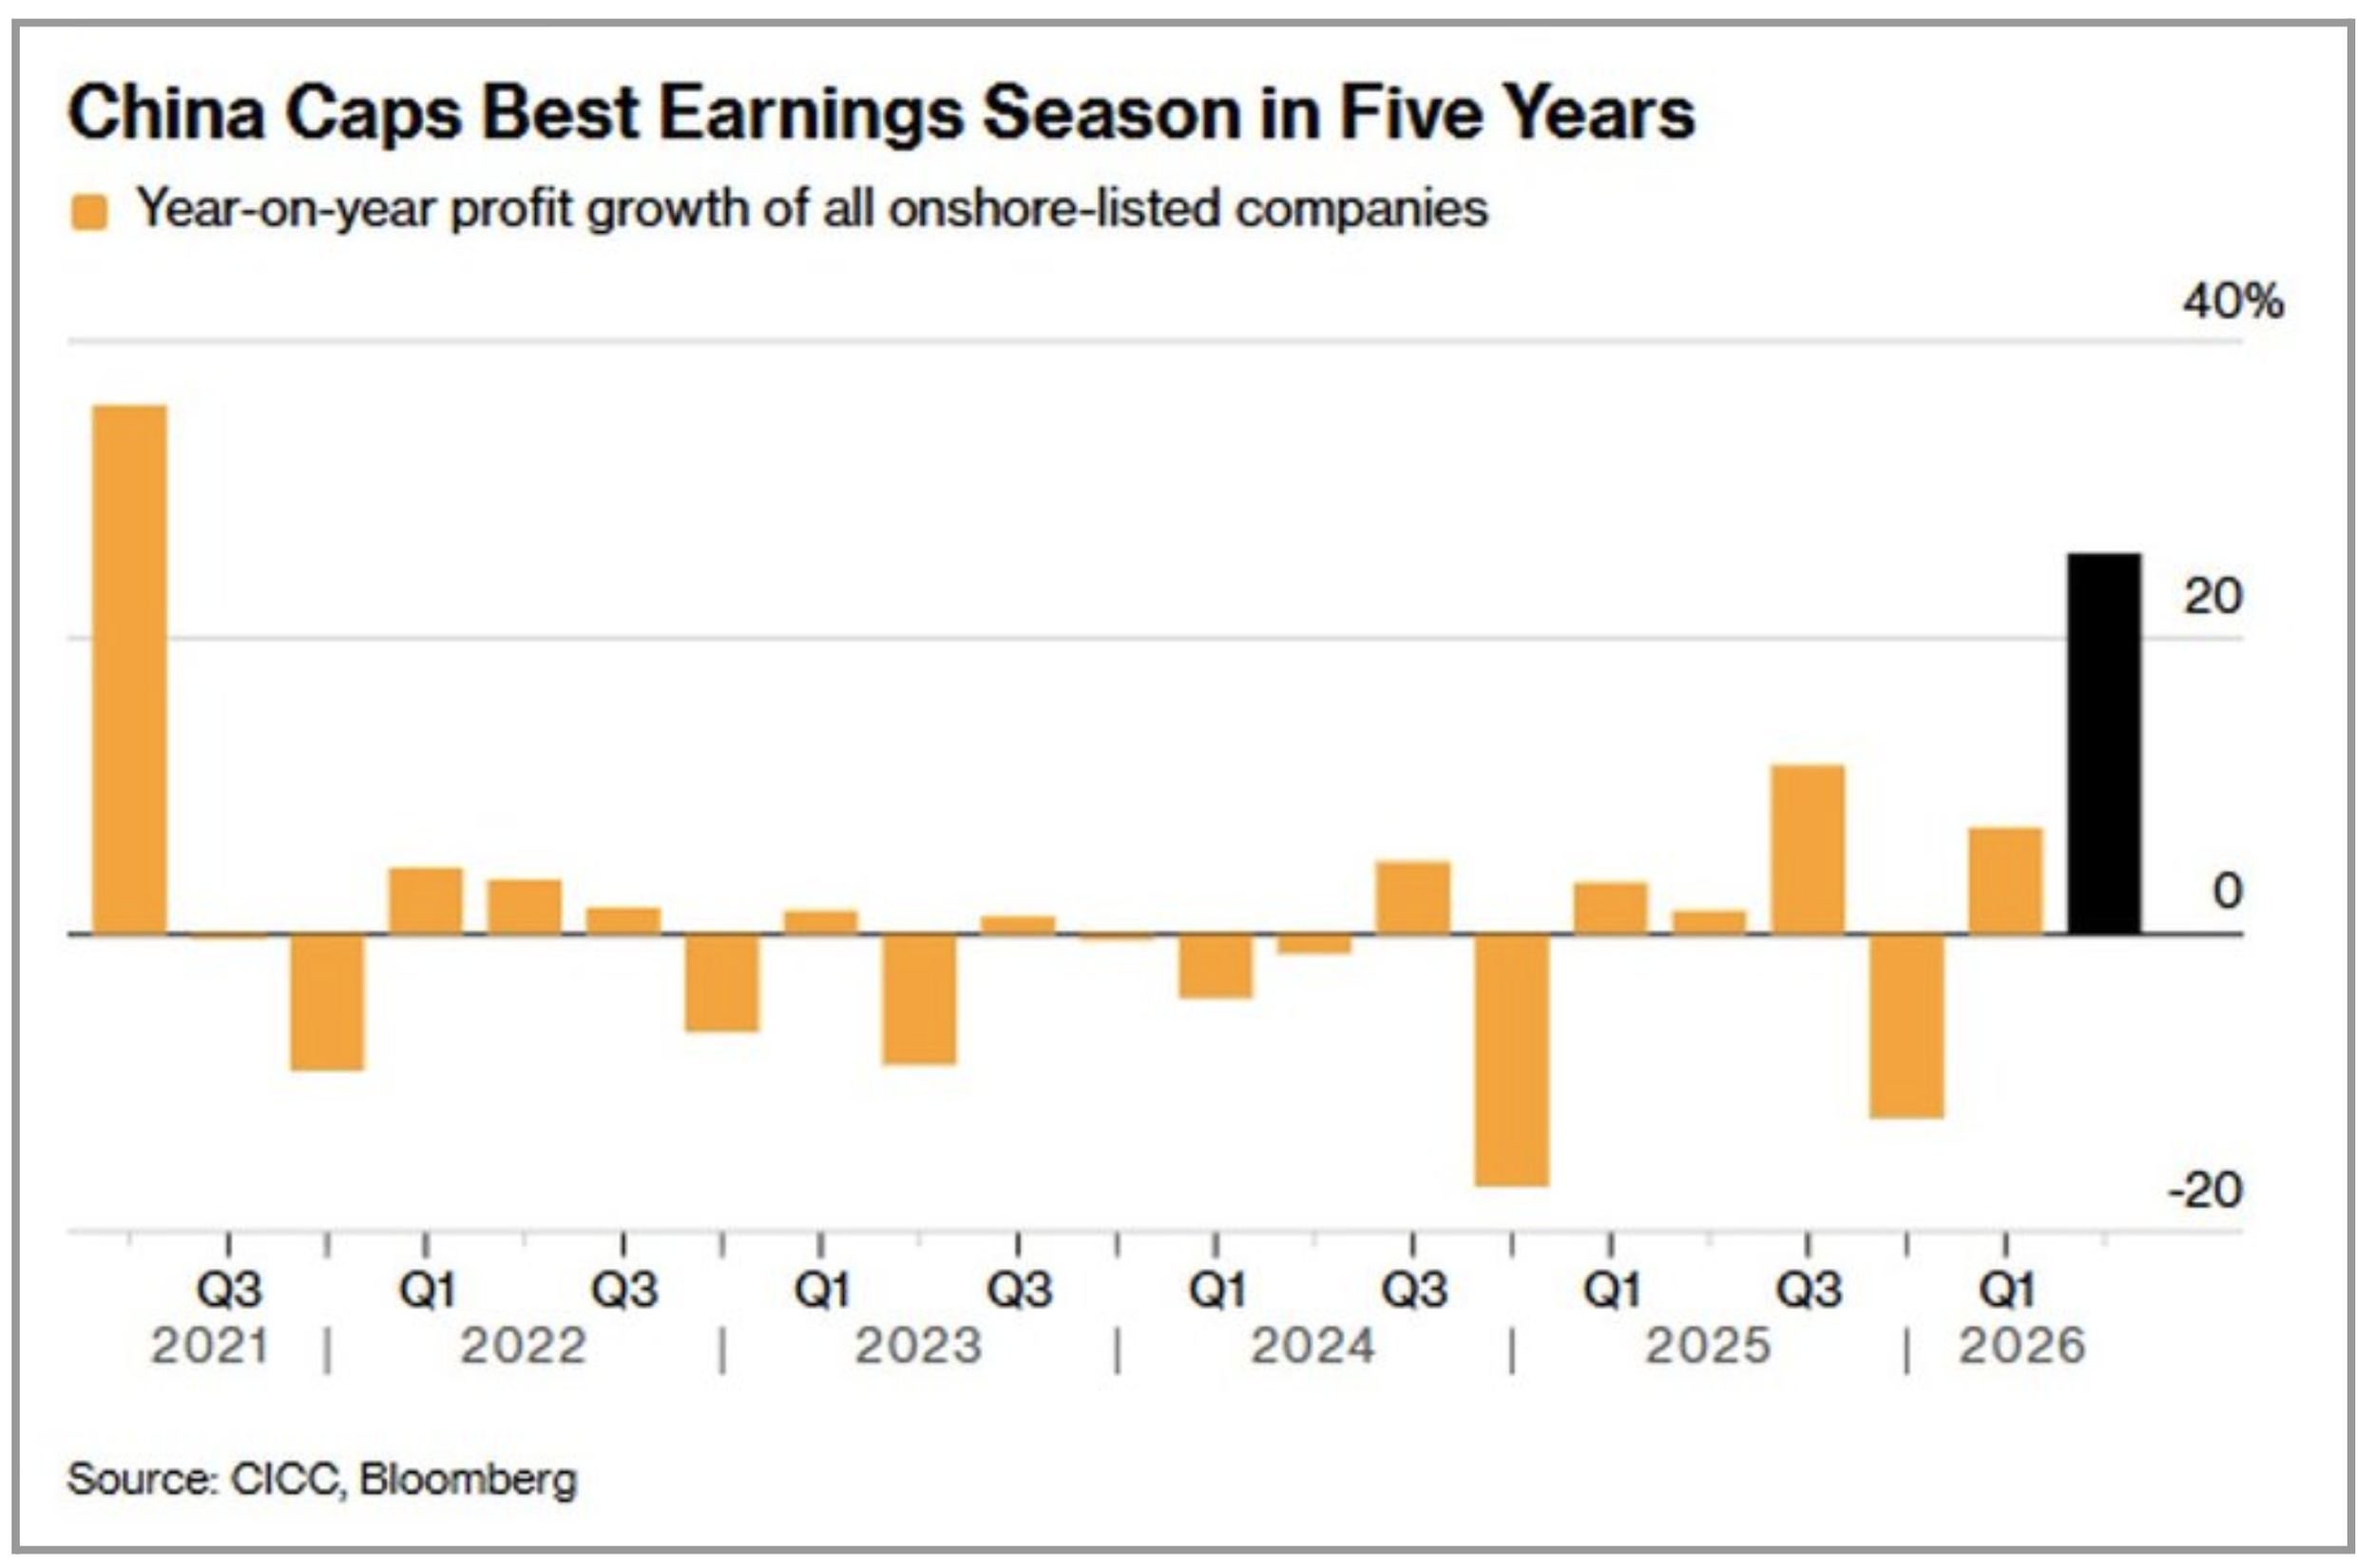
Key drivers included advances in high-tech manufacturing, artificial intelligence initiatives, semiconductors, automobiles, and export-oriented industrial equipment. On a quarter-to-quarter basis since mid-2025, these high-growth companies have seen revenue improve, along with progressively higher gross and operating margins. This could happen only through price increases, reflecting their technological edge.
A company we invest in that produces over 200 components for Apple iPhone has seen its component unit price double for the new iPhone 18 and Duo. Its gross margin for the segment is expanding to 30% because of the company’s innovation in specialized parts and scale production capabilities that beat Taiwanese and Korean suppliers.
The market seems disconnected. Despite the strong corporate numbers, the CSI 300 Index slipped about 9%, and the Star 50 Index fell sharply during the same quarter as investors fretted over a sluggish domestic economy, property-sector drags, and uncertain AI monetization.
The fundamentals are constructive, with easy monetary policy and supportive fiscal policy, but the market is not. Patience remains the name of the game.
Appendix 1
China Consumer Behavior in 2026 vs 2025
We have a deep dive into consumer behavior during the 2026 National Day holiday versus the 2024 and 2025 National Day holidays, as well as the 2026 May Day and Spring Festival Golden Weeks this year.
In short, the 2026 National Day holiday saw steady volume growth, but a continued "volume-over-value" trend, with per-capita spending remaining subdued even though there is an increase in volume in leisure and restaurant visits.
A data-driven comparison of consumer behavior during the 2026 National Day holiday versus the 2024 and 2025 National Day holidays, as well as the 2026 May Day and Spring Festival Golden Weeks. The data reveals a complex picture: the 2026 National Day holiday saw steady volume growth, but a continued "volume-over-value" trend, with per-capita spending remaining subdued even as specific service sectors like leisure and dining showed strong momentum.
Key Holiday Data at a Glance
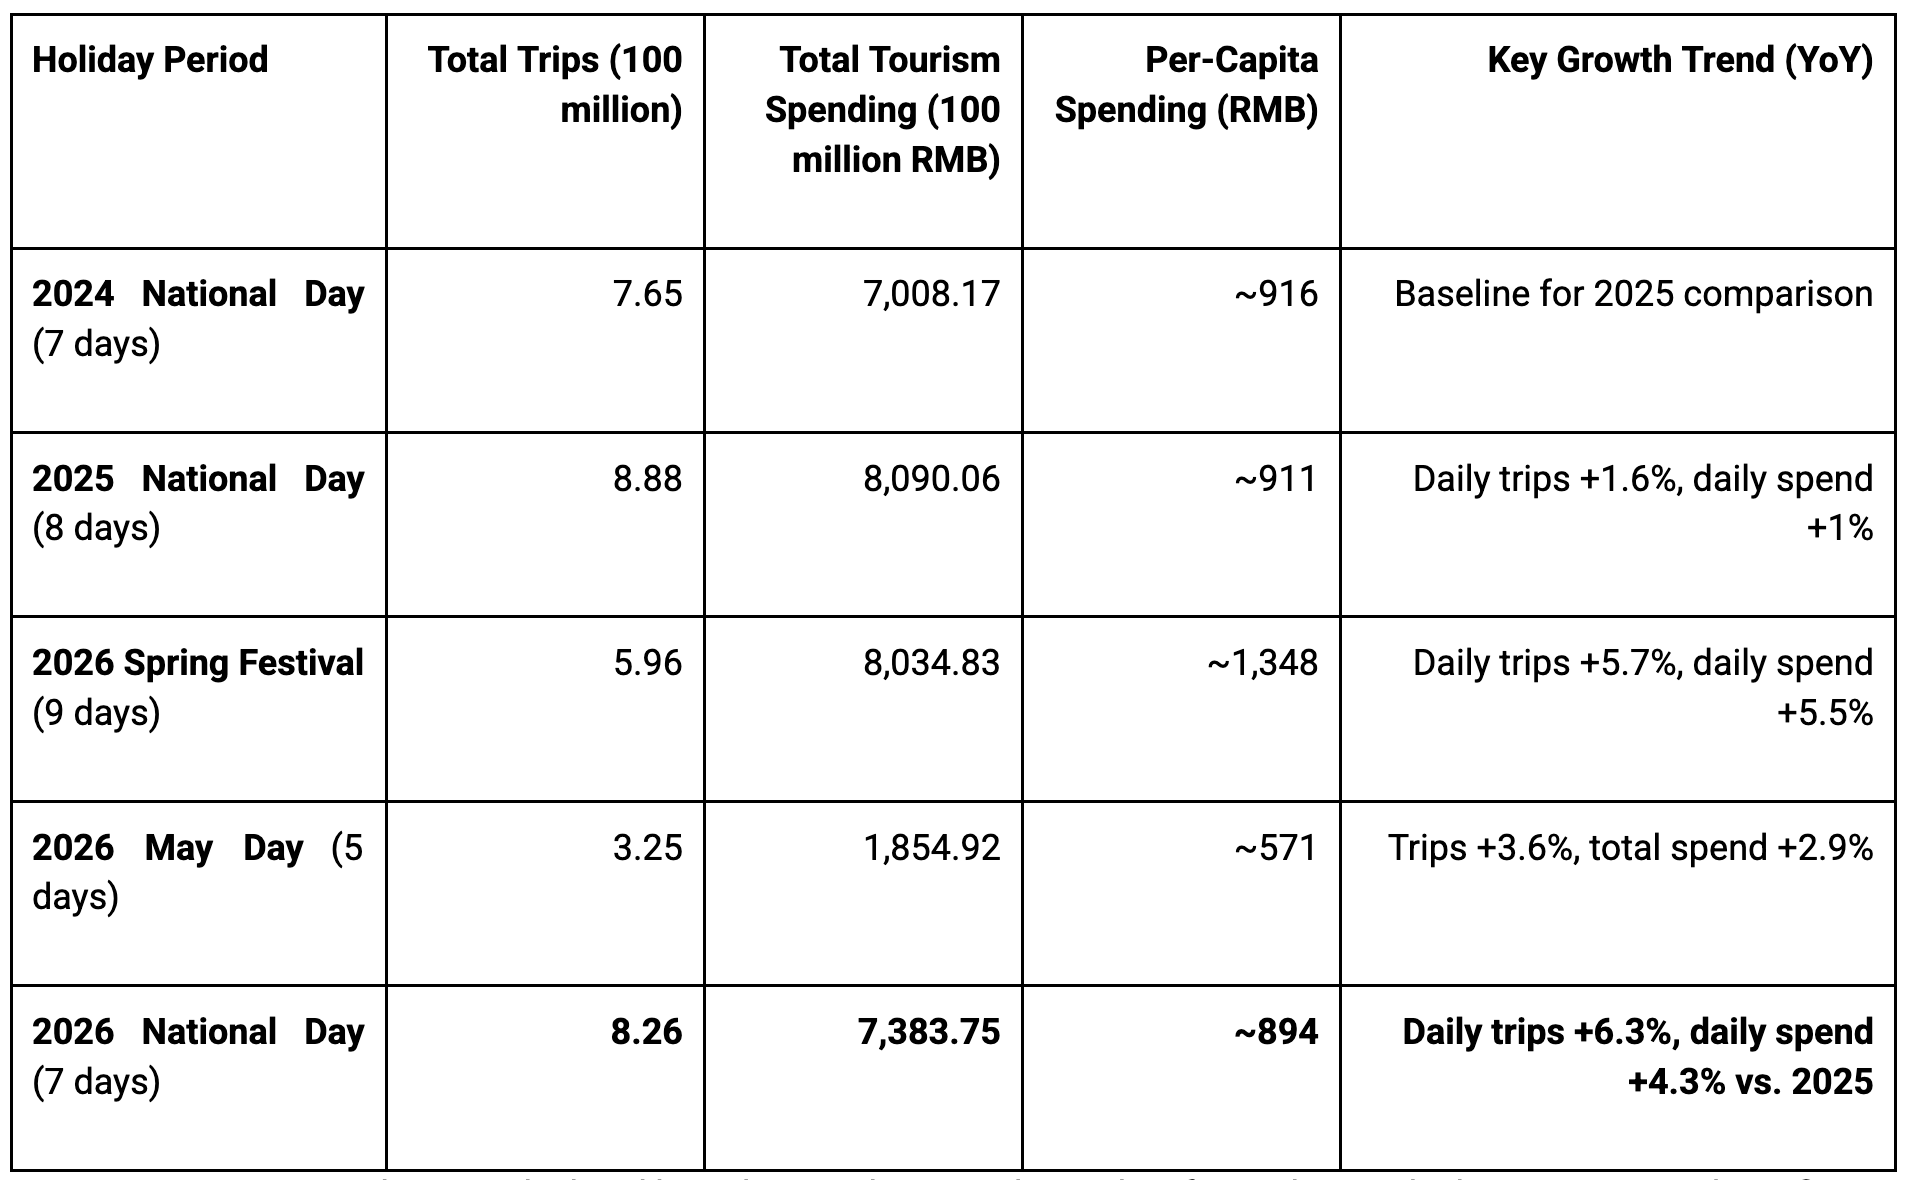
Note: Per-capita spending is calculated based on total trips and spending for each period. The 2026 National Day figure is notably lower than previous major holidays.
Trips & Transportation: Volume Grows, but Spending is Cautious
The 2026 National Day holiday saw a solid recovery in travel volume, with 826 million domestic trips, a daily average increase of 6.3% over 2025. This indicates a strong desire to travel. However, the per-capita spending of approximately 894 RMB was lower than in previous National Day holidays (e.g., ~916 RMB in 2024), confirming a trend of "volume growth without value growth".
In terms of transportation, consumers showed a clear preference for cost-effective options:
Rail was a major beneficiary, with passenger volume during the first six days of the 2026 National Day holiday up 13.6% year-on-year, far outpacing the 0.1% growth in road traffic.
This contrasts with the 2026 May Day holiday, where high oil prices were cited as a factor squeezing out air travel, leading to a 5.74% decline in civil aviation passenger volume.
The average travel radius during the 2026 National Day holiday expanded to 214.56 km, a 15.8% increase from 2024, suggesting people are willing to travel farther but are managing costs carefully.
Restaurant Spending: A Clear Outperformer
Dining out was a standout category, consistently outperforming overall retail sales across all major holidays in 2026. This reflects a strong consumer preference for experiential and service-based consumption.
2026 National Day: Catering sales revenue grew 9% year-on-year, with snack food sales surging 15.5%.
2026 Spring Festival: Restaurant revenue was a major driver of consumption, growing 31.2% year-on-year, with casual dining up 26.5% and snack services up 42.1%.
2026 May Day: The momentum continued, with catering sales revenue jumping 31.4%.
Leisure & Entertainment: The New Growth Engine
Leisure and entertainment emerged as the most dynamic segment of consumer spending, a trend that was particularly pronounced during the 2026 National Day holiday.
2026 National Day: Revenue from tourism, leisure, and entertainment services soared 23.6% year-on-year. Within this, amusement park consumption grew 41.2% and travel agency services grew 26.2%.
2026 May Day: This sector also performed well, with tourism and entertainment service revenue up 21.2%.
This data points to a consumer who is prioritizing experiences over material goods, a key behavioral shift in the post-pandemic era.
Shopping: Polarized and Value-Conscious
Retail shopping presented a mixed picture, with strong policy support driving specific categories while overall growth remained moderate.
2026 National Day: While overall retail sales were muted, trade-in programs for consumer goods remained a key policy driver. The average transaction value at key commercial districts saw its best growth of the year, indicating that when consumers do shop, they are doing so in physical retail environments. Duty-free shopping in Hainan saw a 5% increase in sales, but this was driven by a 13% increase in the number of shoppers, as per-capita spending in this segment fell 7.4%.
2026 Spring Festival: Policy-driven categories were a highlight. Retail sales of smart glasses and embodied AI robots surged 47.3% and 32.7%, respectively.
2026 May Day: Retail sales also benefited from trade-in policies, with general retail sales up 12.4%, driven by strong demand for cosmetics (+55.8%) and gold/jewelry (+28.8%).
Summary: The "Volume-Value" Gap and Policy Implications
The data from the 2026 holidays paints a consistent picture of the Chinese consumer:
Travel demand is robust, but spending is increasingly value-conscious, with a clear preference for cost-effective transportation like rail.
Service consumption, particularly dining and leisure, is the primary engine of holiday spending growth. Consumers are prioritizing experiences.
Retail spending is more selective and polarized, driven largely by government trade-in policies that boost demand for big-ticket, upgrade-oriented goods (smart devices, cars).
For policymakers, this suggests that stimulating consumption requires a dual approach: continuing to support service sectors like tourism and dining, which are driving growth and employment, while using targeted policies like trade-in programs to unlock demand in the goods sector. The overall "volume-over-value" trend indicates that consumer confidence, while showing signs of recovery in travel propensity, remains cautious regarding broader spending, likely influenced by the broader economic environment.
Appendix 2
China EV market through the eyes of Didi Drivers
Based on recent travel across China and conversations with local drivers, two primary critical points emerge regarding the domestic electric vehicle (EV) sector:
1. Manufacturing Volume, Demand, and Economic Impact
The EV manufacturing ecosystem and its supply chain are vital to employment in China.
State-Owned vs. Private Manufacturers: State-owned enterprises (SOEs) produce a substantial volume of EVs with acceptable aesthetics, interior fittings, and drivability. However, their parts and components often trail the quality found in leading private brands such as BYD and Zeekr. Consumers and drivers can increasingly distinguish high-quality vehicles from mediocre state-produced models.
Scale and Supply Chain Viability: High production volumes and widespread adoption are essential to drive unit costs down. Without sufficient scale, capital expenditure (CapEx) depreciation per unit remains high, raising component and production costs. Large-scale manufacturing provides the vitality needed to sustain the entire supply chain.
Government Support & Job Creation: Demand injection from local governments plays a significant role. For instance, municipal initiatives in Shanghai purchased substantial fleets of Roewe/SAIC EVs. This provided guaranteed demand for manufacturers and downstream taxi/ride-hailing operators, securing employment across both factory floors and service sectors.
ESG Alignment: Beyond driving social stability through job creation, widespread EV integration advances broader global ESG (Environmental, Social, and Governance) targets by driving environmental improvements.
2. Shifting Consumer Expectations and Quality Standards
As EVs become more affordable, consumer and driver expectations regarding quality are rising rapidly.
Ride-Hailing Fleet Standards: China’s ride-hailing fleet vehicles show surprisingly high build quality and interior fit and finish. China's fleet vehicles offer a noticeably superior passenger experience. However, Didi drivers are very critical of their cars' standards. Many 上汽飞凡F7 drivers complain that the cars are poorly made and the components are inferior. When comparing equivalent vehicle classes in Singapore, Grab Premium vehicles are mostly Toyota Noah, Honda Stepwagon, or the 2022/3 Mercedes models; the Chinese EV shines despite those complaints. Their gripes center on comparing their SOE-manufactured vehicle with those made by private enterprises such as BYD, Zeekr, Denza, Nio, Xpeng, etc., and rarely with foreign-made cars. They even think that the new Audi EV produced in partnership with SAIC is rubbish. It says a lot about consumer expectations in China today, and their lack of confidence in the state-owned companies is more psychological. Having said that, the new EV phenomenon was a post-COVID success, that is, with a history of less than 5 years, but the penetration to the rest of the world sent chills to the US and Europe.
Similarly, when one looks at China Mobile's thoughtful build-out of a national communication network with firewalls, security, etc., or the China rail systems, or the hydroelectric solar and wind farm proliferation, to name a few, the state engineering ability is remarkable, where few can challenge. The historical baggage of inferiority in SOE-produced products must be reconsidered.

Market Differentiation: While SOE-produced mid-tier and some high-end EVs offer solid baseline quality, looks, and interior fittings, market leaders are pulling ahead into a distinct class. Higher consumer standards are forcing automakers to keep innovating and improving rather than relying on government-backed SOE demand. This will inevitably push vehicle production standards to the next level across the industry and make them more desirable than some Western-built vehicles at a very reasonable price. As a result, they become an instant hit in export markets like Australia, UK, Europe, and Canada, South America etc.
This mirrors the experience of Japanese and Korean automakers and consumer electronics giants. In the 70s, Whirlpool, Electrolux, Ford, GM, and GE were the top brands. In the 80s and 90s, Japanese brands like Toshiba, Hitachi, Sony, Toyota, and Honda took over. By the 2000s, Korean brands became relevant: Samsung, Hyundai, Kia, LG, etc. Naturally, through tough domestic competition, Chinese factories are making better products and catching the world's attention in the same way as their predecessors. It was said that demand for quality from Japanese consumers drove innovation and improvement in Japanese brands. This is now happening in China at scale.
Summary
Elevated consumer expectations will continue to drive product innovation and improvements across the sector. Combined with the ability to manufacture at scale while maintaining reasonable price points, top Chinese EV manufacturers remain well positioned relative to global competitors. Similarly, in many other product segments.
Disclaimers:
This article expresses the author's views as of the date indicated on the publication and such views are subject to change without notice. Gratus has no duty or obligation to update the information contained herein. Certain statements contained herein constitute forward-looking statements, which are subject to known and unknown risks, uncertainties, and assumptions. Actual events or results may differ materially from those reflected or contemplated in such forward-looking statements. Further, Gratus makes no representation, and past investment performance should not be assumed to indicate future results. Moreover, wherever there is a potential for profits, there is also the possibility of loss. This publication is made available for educational purposes only and should not be used for any other purpose. The information contained herein does not constitute and should not be construed as an offering of advisory services, a recommendation to buy or sell any securities or related financial instruments in any jurisdiction. Any reference to specific companies or securities is for illustrative purposes only and may not represent actual holdings of any Gratus’ portfolio. Certain information contained herein concerning economic trends and performances is based on or derived from information provided by independent third-party sources. Gratus Investment Management Private Limited (“Gratus”) believes that the sources from which such information has been obtained are reliable. However, it cannot guarantee the accuracy of such information and has not independently verified the accuracy or completeness of such information or the assumption on which such information is based. This publication, including the information contained herein, may not be copied, reproduced, republished or posted in whole or in part in any form without the prior written consent of Gratus. Accordingly, neither we nor any of our associates, directors, connected parties and/or employees accept any liability whatsoever for any loss, whether direct or indirect, that may arise from the use of information or opinions provided.
Related Insights