Letter to Investors Q2
CIO Office

Mid-Year Review
Muddling the Water
Half a year has passed, and 2026 has proven even more eventful than 2025's "Liberation Day." It began early, on 3rd January, with the capture of Maduro, and has continued through a World Cup red card suspension reprieve and the resumption of bombing in Iran. Trump has, by any measure, been busy.
Convoluted world events of this kind tend to sort countries into three groups: those with the power to call the shots, those who are well prepared strategically, and those who are ill prepared. Watching where each region and country performs in the second quarter has provided us some basis for our positioning for the second half.
Amid the disorder, the United States has benefited the most, particularly under Trump's strategic push to rebuild domestic infrastructure and manufacturing capacity while dampening Asian manufacturing strength.
China, for its part, has benefited from being strategically well prepared, the product of years of multi-year government planning, a page Trump himself appears to admire, given moves like capping medicine prices and taking golden shares in companies of national interest, Intel among them.
That said, further delays in reopening the Strait of Hormuz will inevitably weigh on China as well. China's nonchalant posture through all of this leaves us wondering what hidden leverage it may be holding in reserve.
Our focus
On macro risks, we are monitoring Hormuz developments, energy and inflation outlooks, consumer conservatism, AI euphoria, an erratic market structure in Korea, an unsustainable economic structure in some Asian countries, and hyperscaler capex and earnings growth.
On market risk, we are concerned with debt and equity issuance:
Specifically, the competition for debt investors with higher US Treasuries and corporate bond issuances, and
A substantial increase in IPOs in the US and other financial centers like Hong Kong.
On opportunity, we find U.S. Treasuries increasingly interesting if yields hold above 4.5% and inflation risk continues to subside, and the job market presents weakness despite the World Cup.
The rest of this letter works through these threads in turn. We start with the U.S. economy: the case for earnings as the driver of this year's rally, the structural forces behind forty years of U.S. equity outperformance, and what the July washout tells us about the evolving market structure and the misunderstanding of leverage 28 years after the LTCM collapse.
That discussion closes with five open questions we think matter more than any near-term data point, on rate policy, AI productivity, reshoring, global competition, and shifting labor demographics, before turning to where we see credit risk without adequate return. From there, we take a closer look at a specific policy risk: what would actually happen if the U.S. restricted energy exports. We then turn to China, where consumer caution, a genuinely transformed capital market, and a first-ever national consumption blueprint tell a more constructive story than headlines suggest. We close with fund performance and positioning for the second half.
2026 Market Outlook
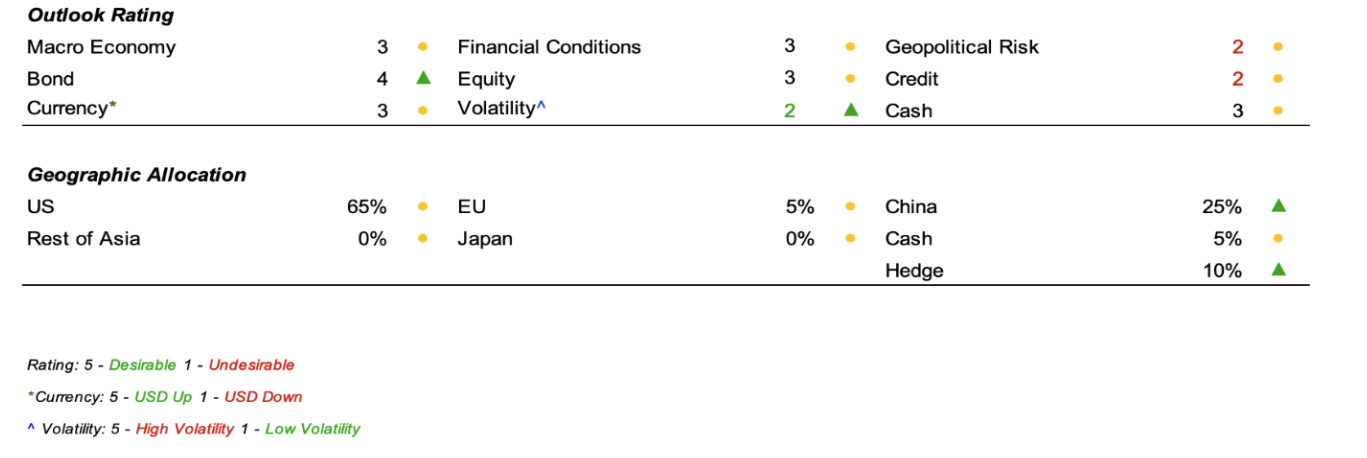
Source: Gratus Investment Management
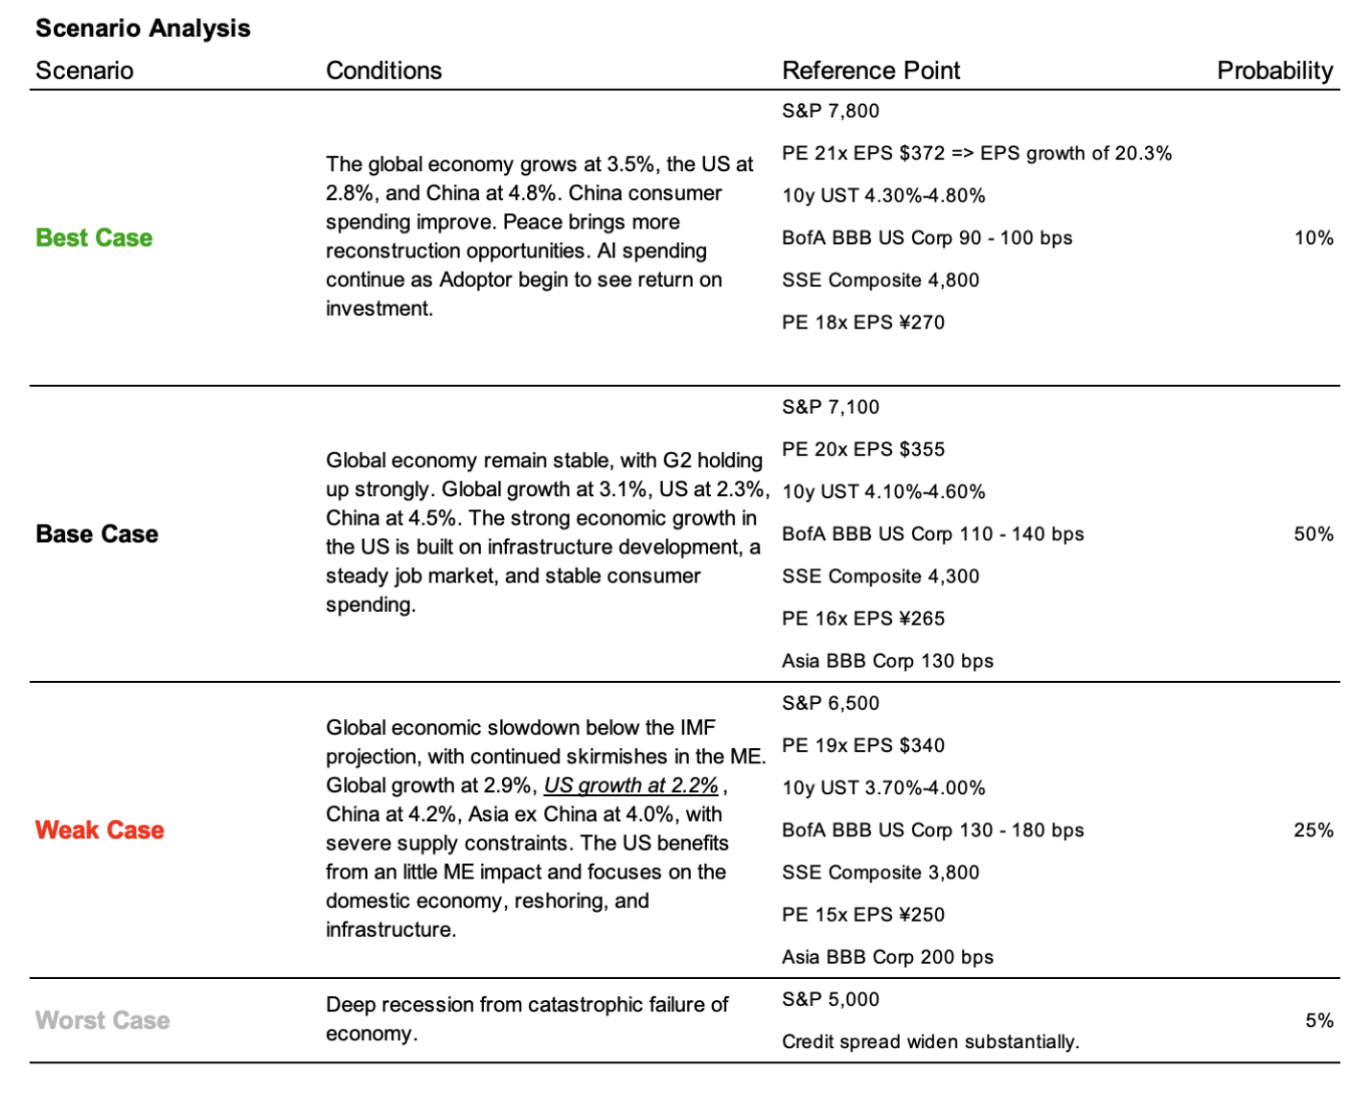
Source: Gratus Investment Management
Markets Performance
This year’s roller coaster market and its scorecard to date:
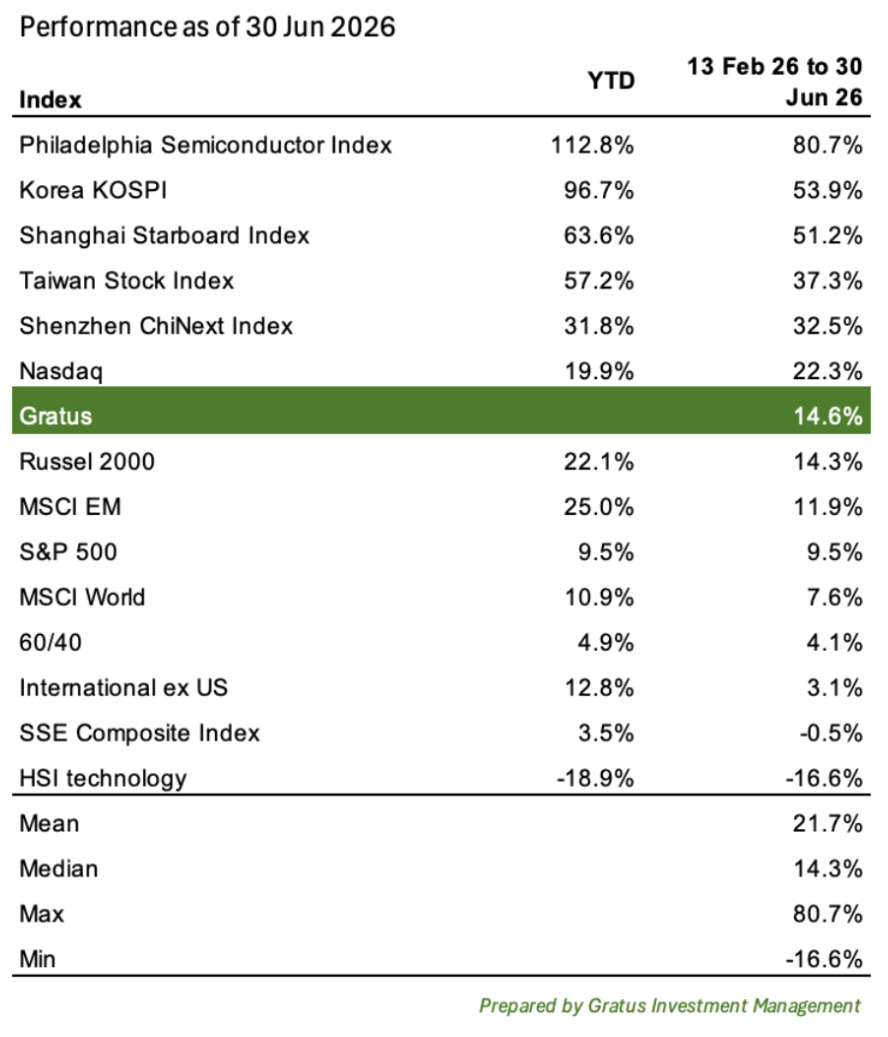
Source: Gratus Investment Management
US Outlook
Navigating the Surface Calm in the US Economy
The current economic landscape presents a picture of stability, but we must be careful not to confuse a lack of visible distress with an absence of risk. The macro aggregates look calm, but beneath the surface, the structural underpinnings are shifting.
1. The Inflation Narrative: Noise vs. Signal
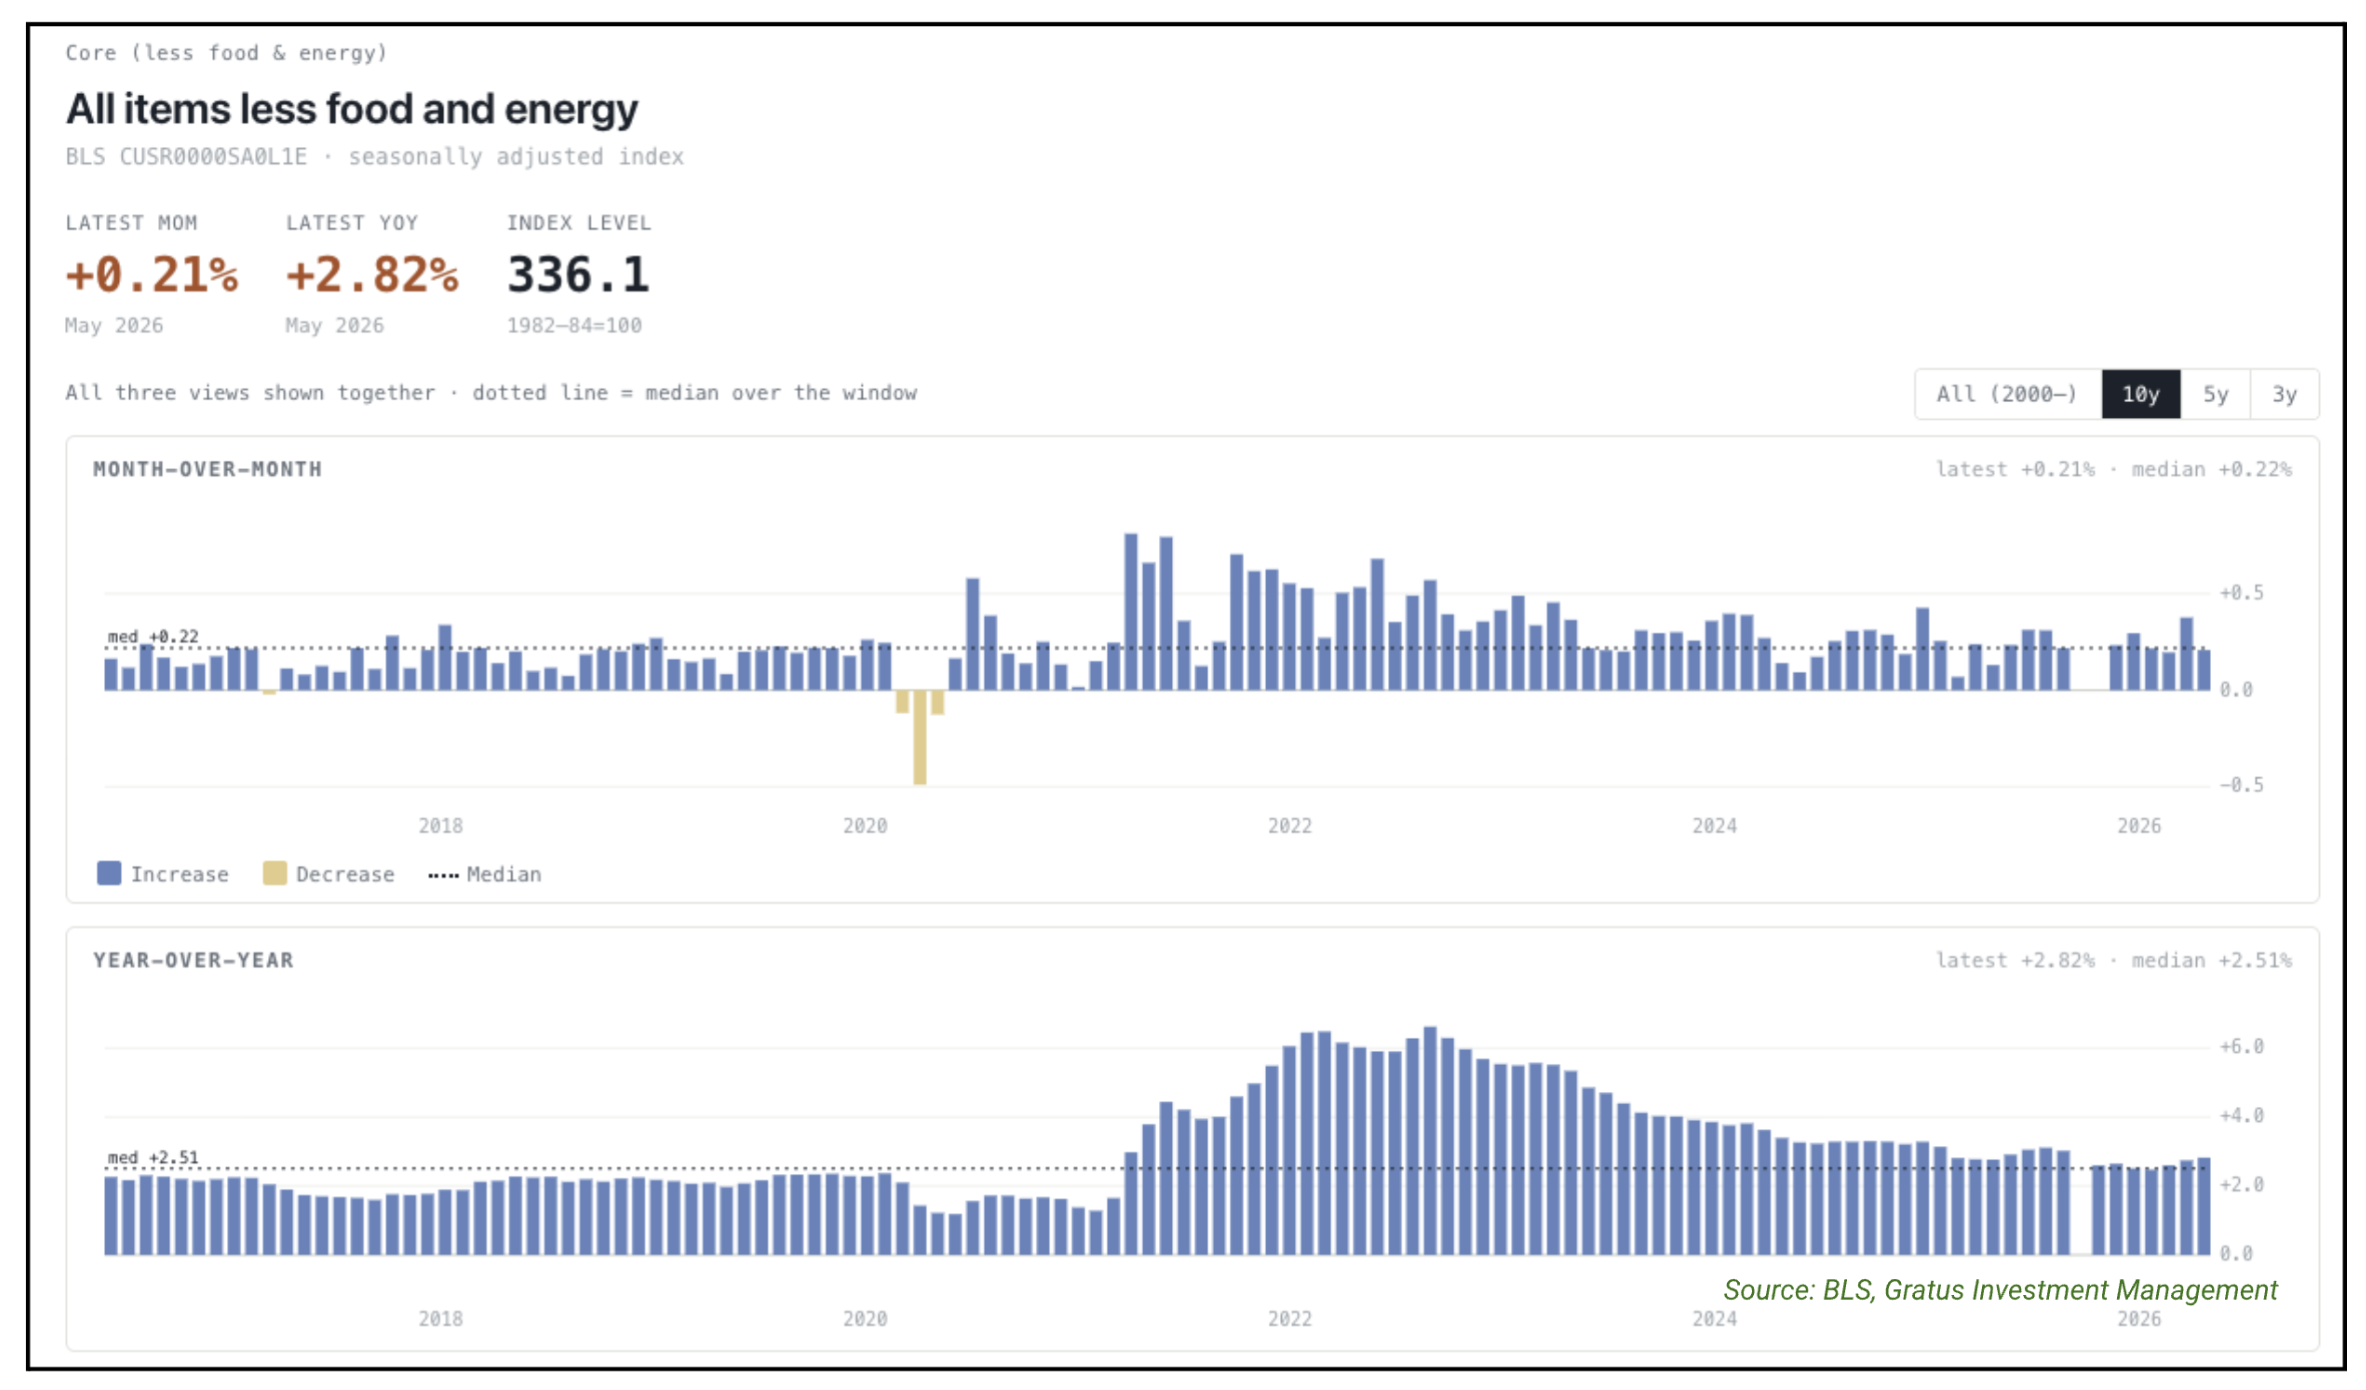
The headline inflation data has been largely hijacked by volatility in energy markets, driven by geopolitical friction in the Middle East. However, when we look past the energy shock (4.6% weight in CPI Index), the disinflationary trend — led by softening rent and services costs that are over 40% weight in CPI — remains intact. We must distinguish between temporary supply-chain disruptions (like the Hormuz and Red Sea disruption) and structural price pressures. The headline number is converging toward the core, not the other way around.
Regarding the El Niño forecast: Markets are prone to worrying about broad-based systemic risk, but often miss the nuance. While this weather event poses real risks to agricultural production in Southeast Asia and Australia, it is a net positive for the US, a major agricultural exporter. This is a classic reminder that macro events rarely impact all participants equally.

2. The Labor Market: Nominal vs. Real
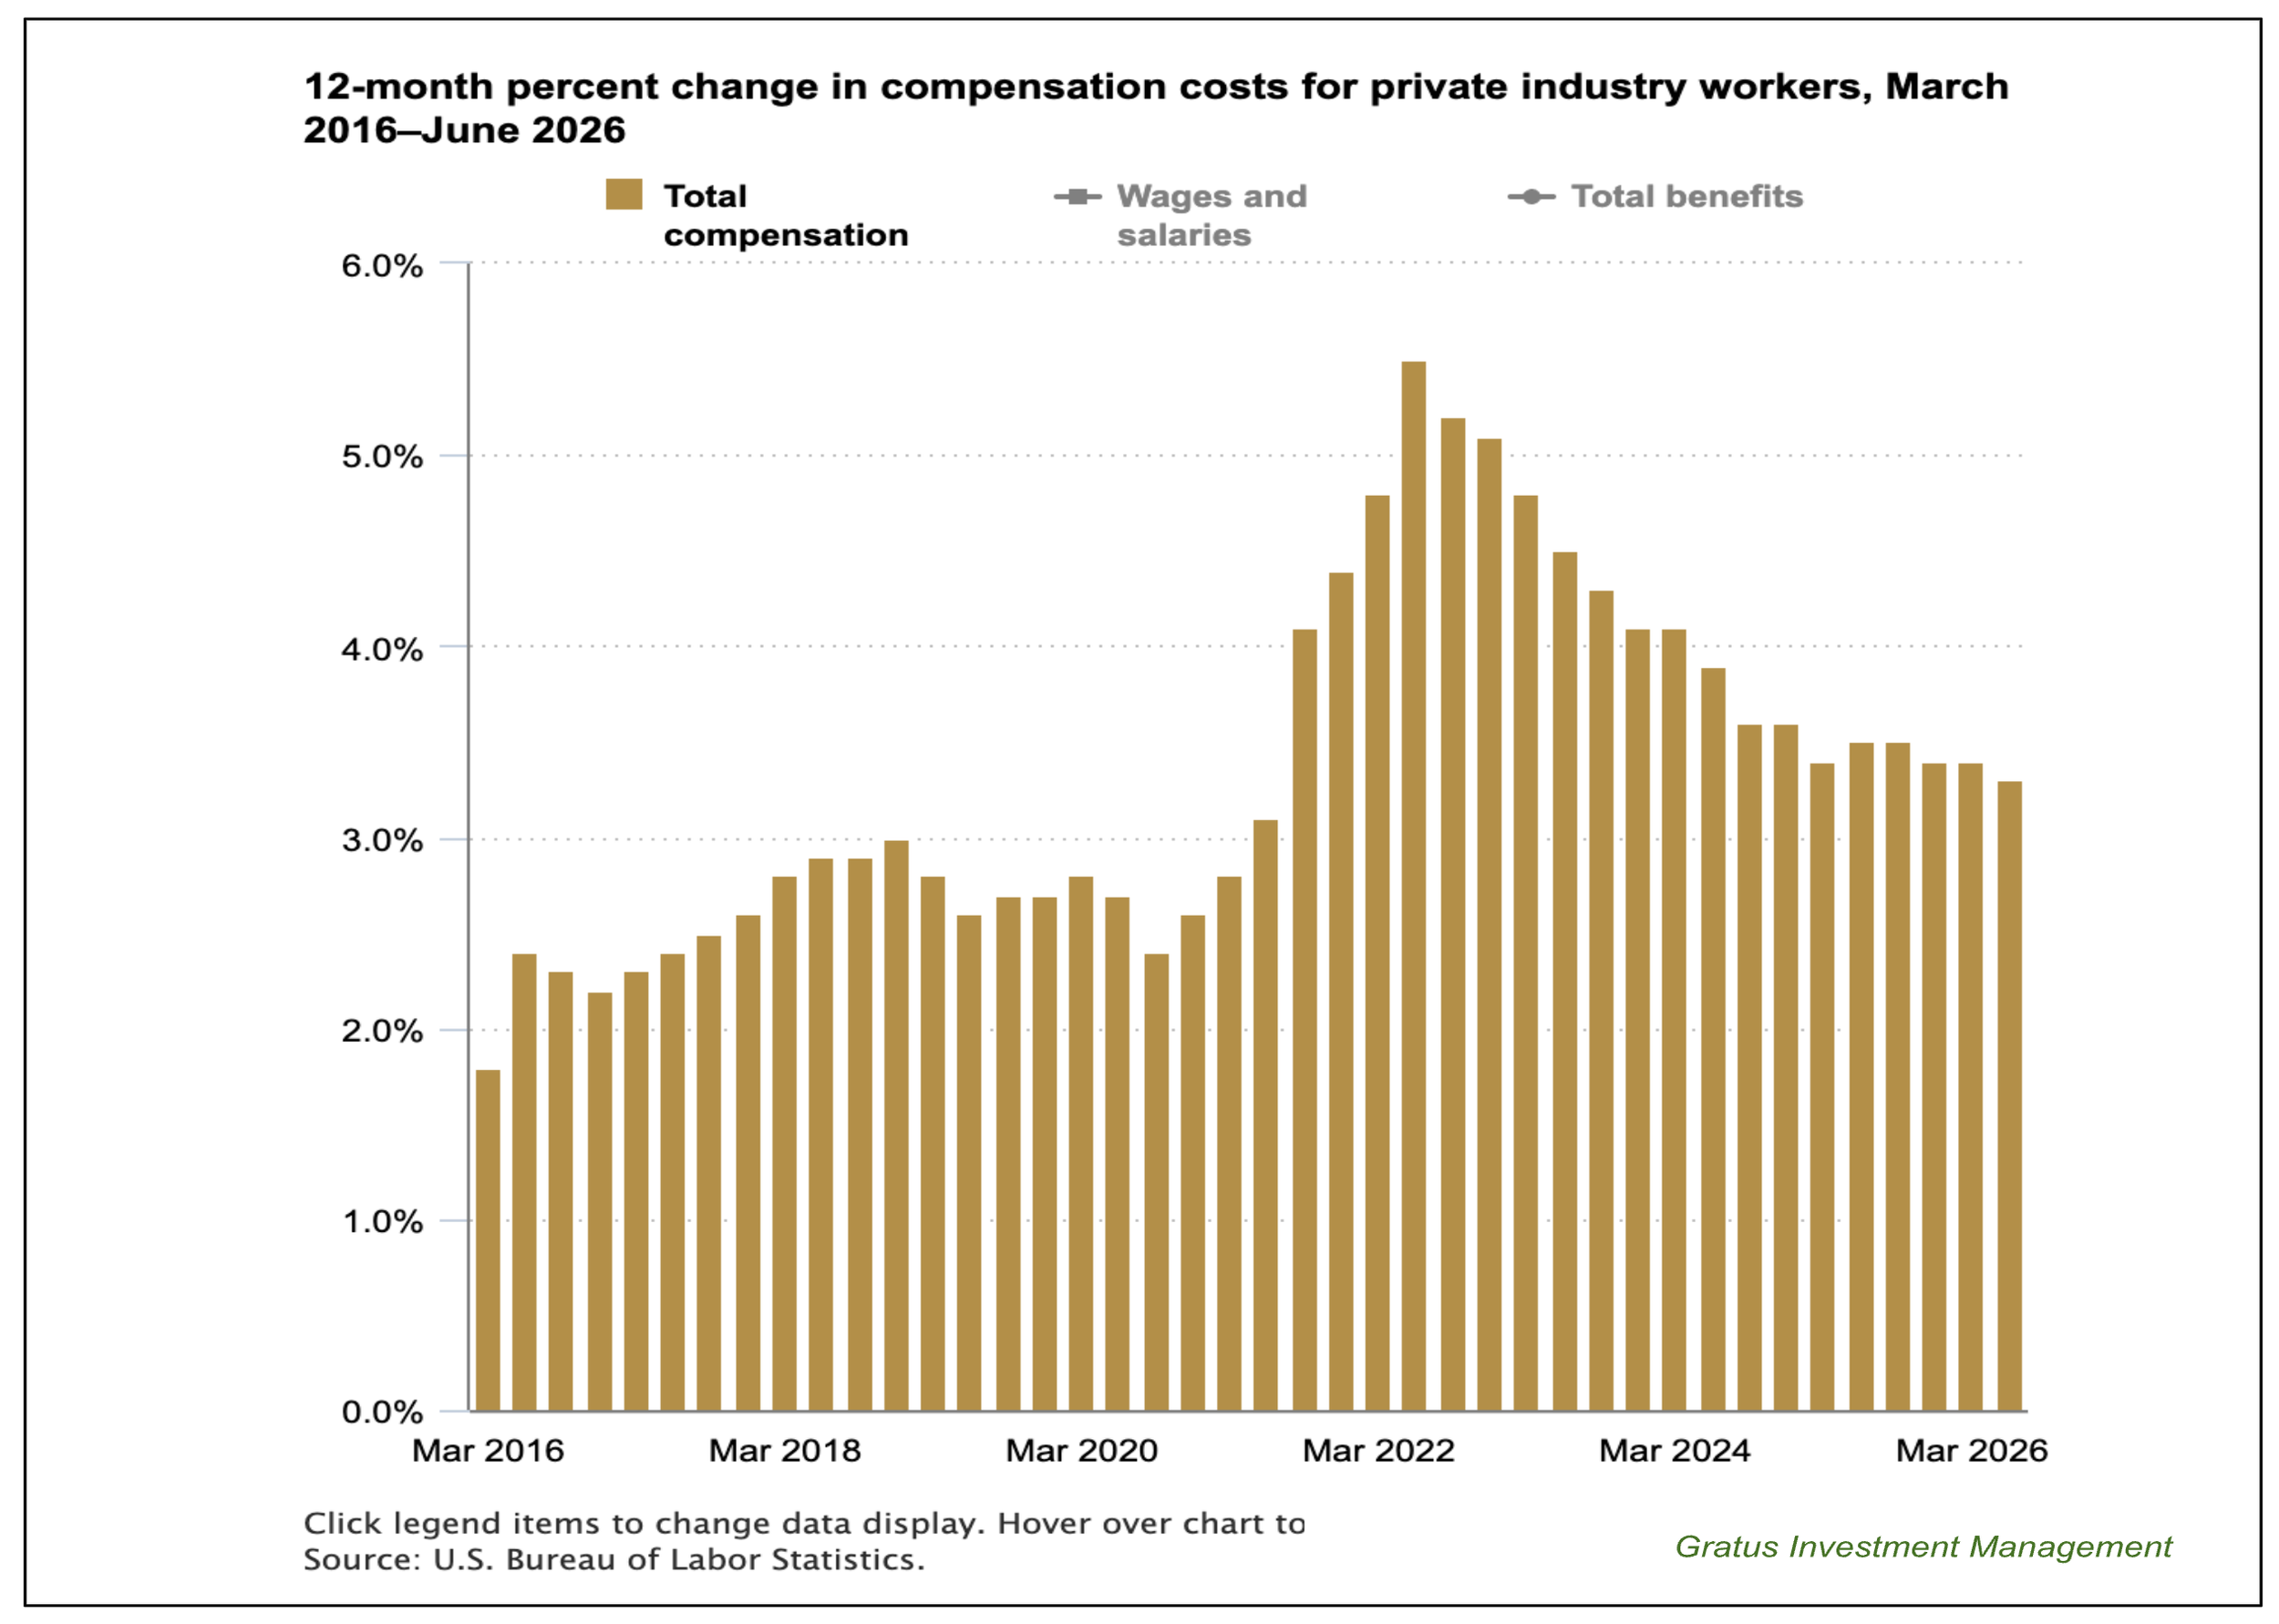
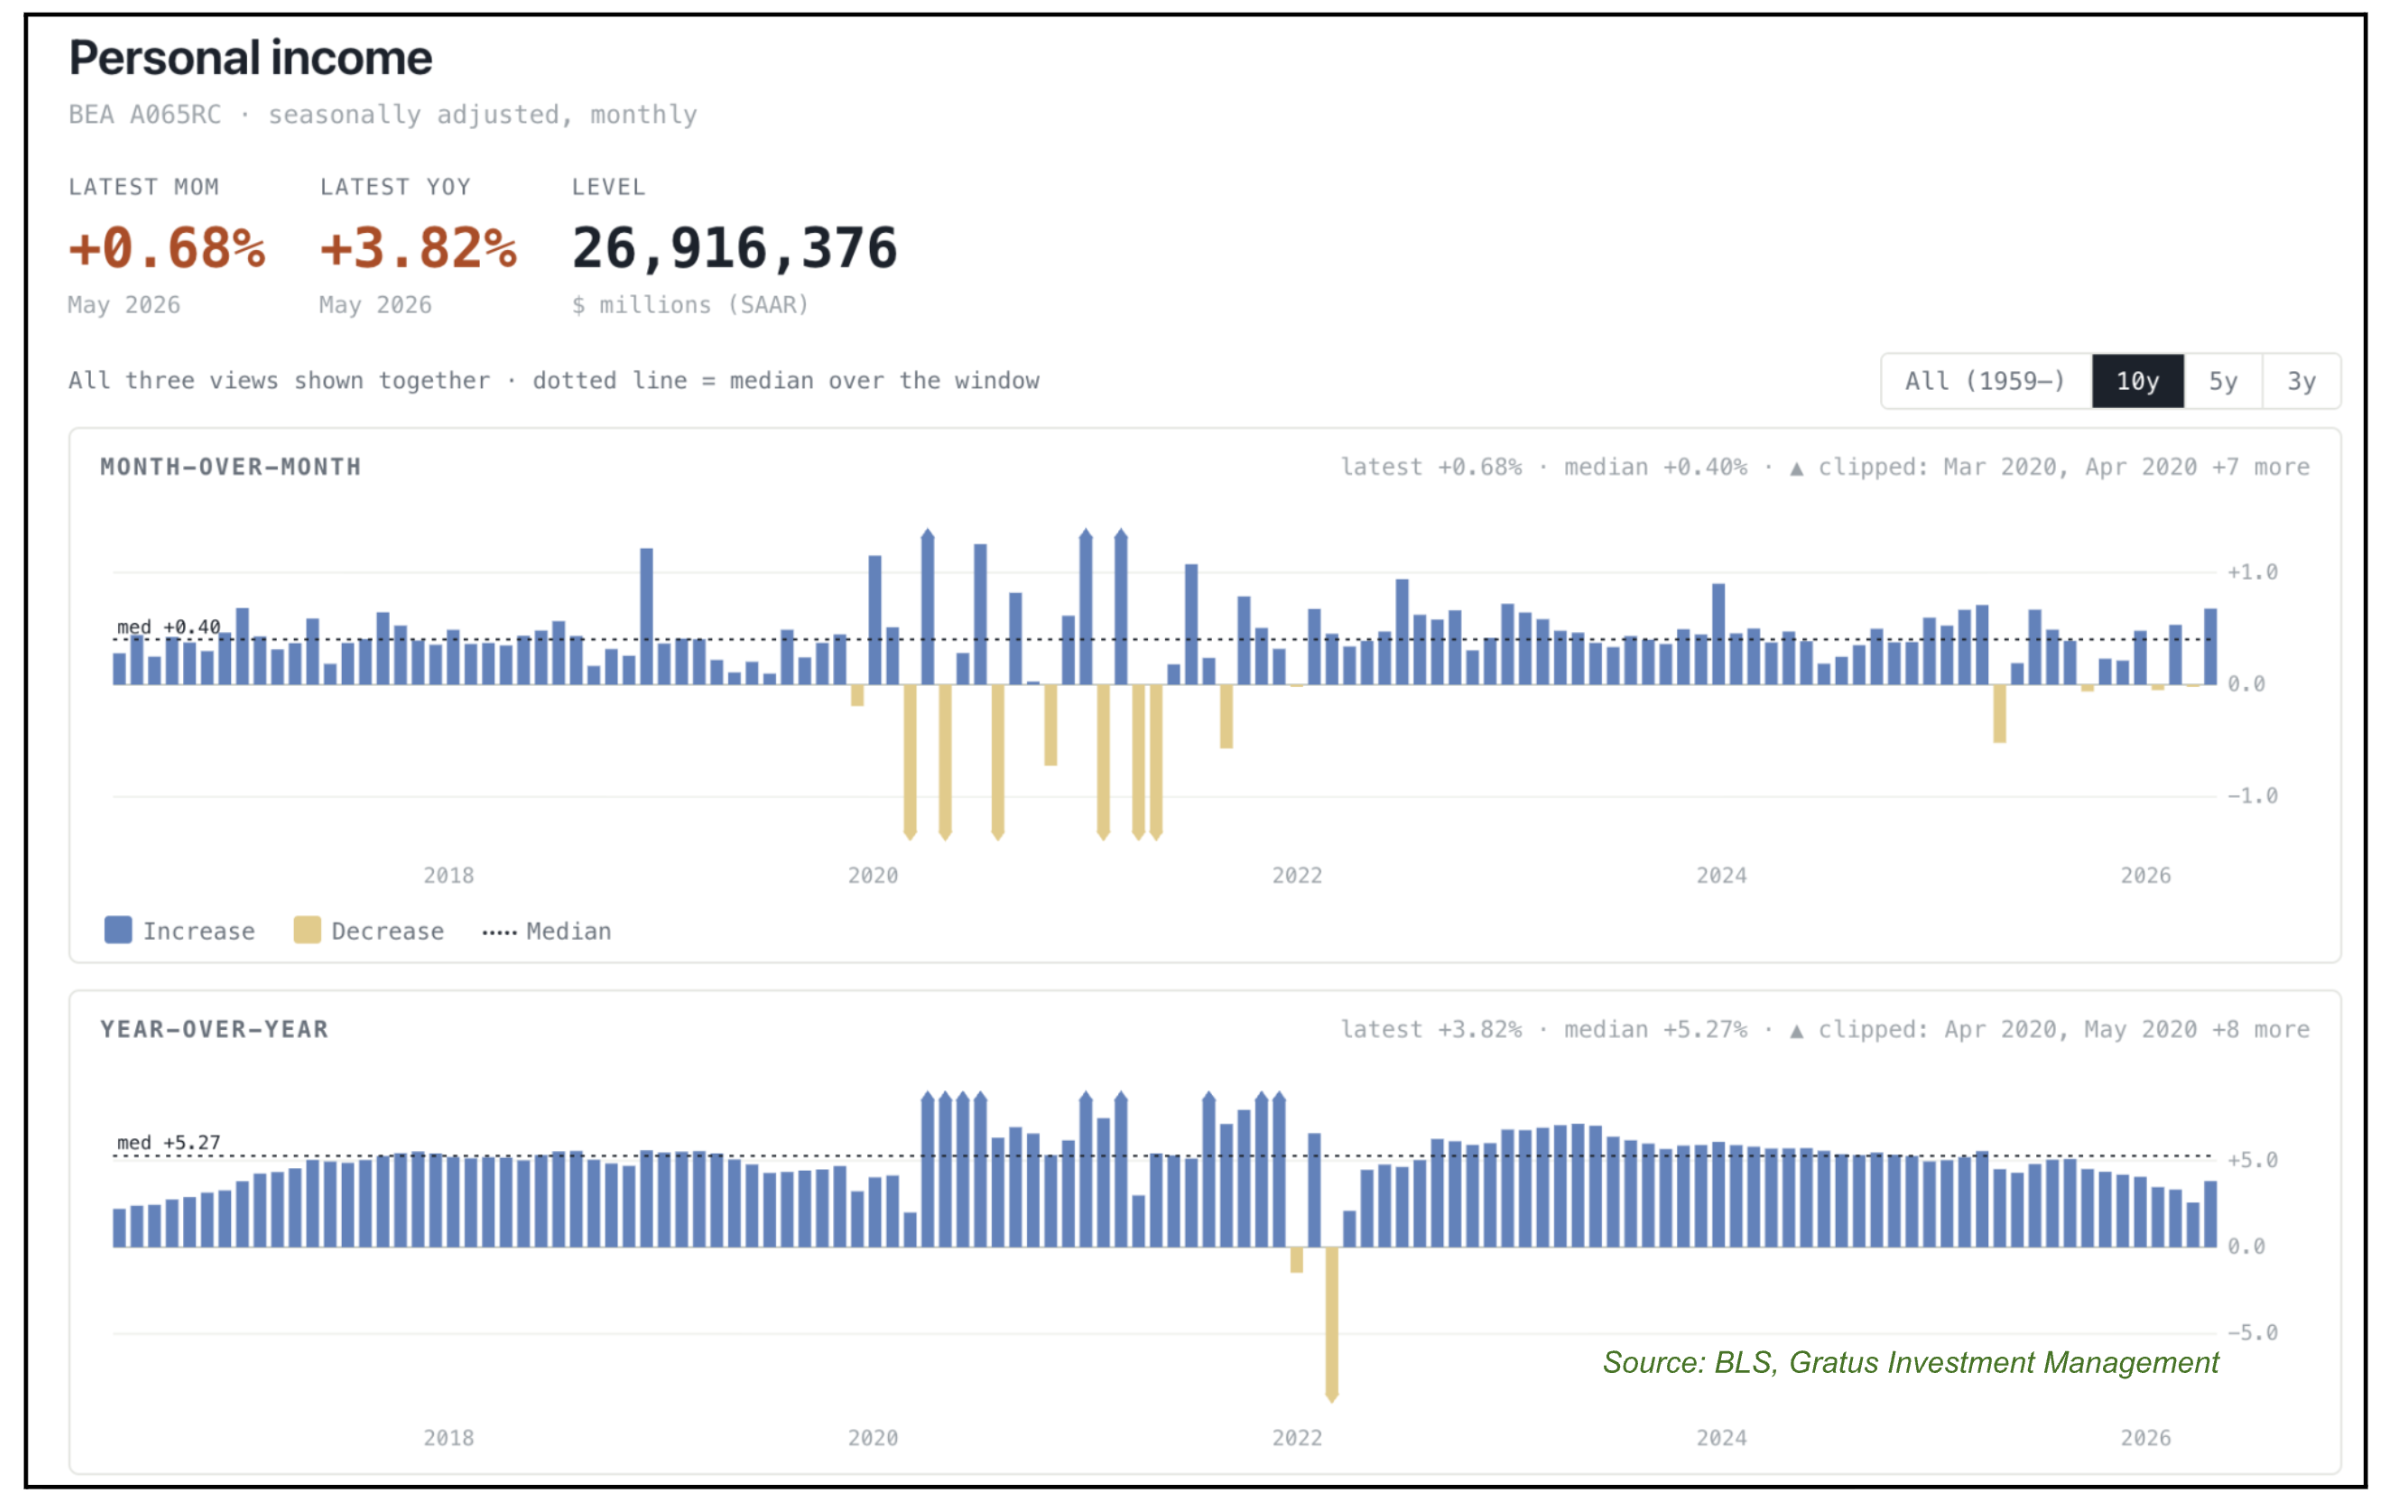
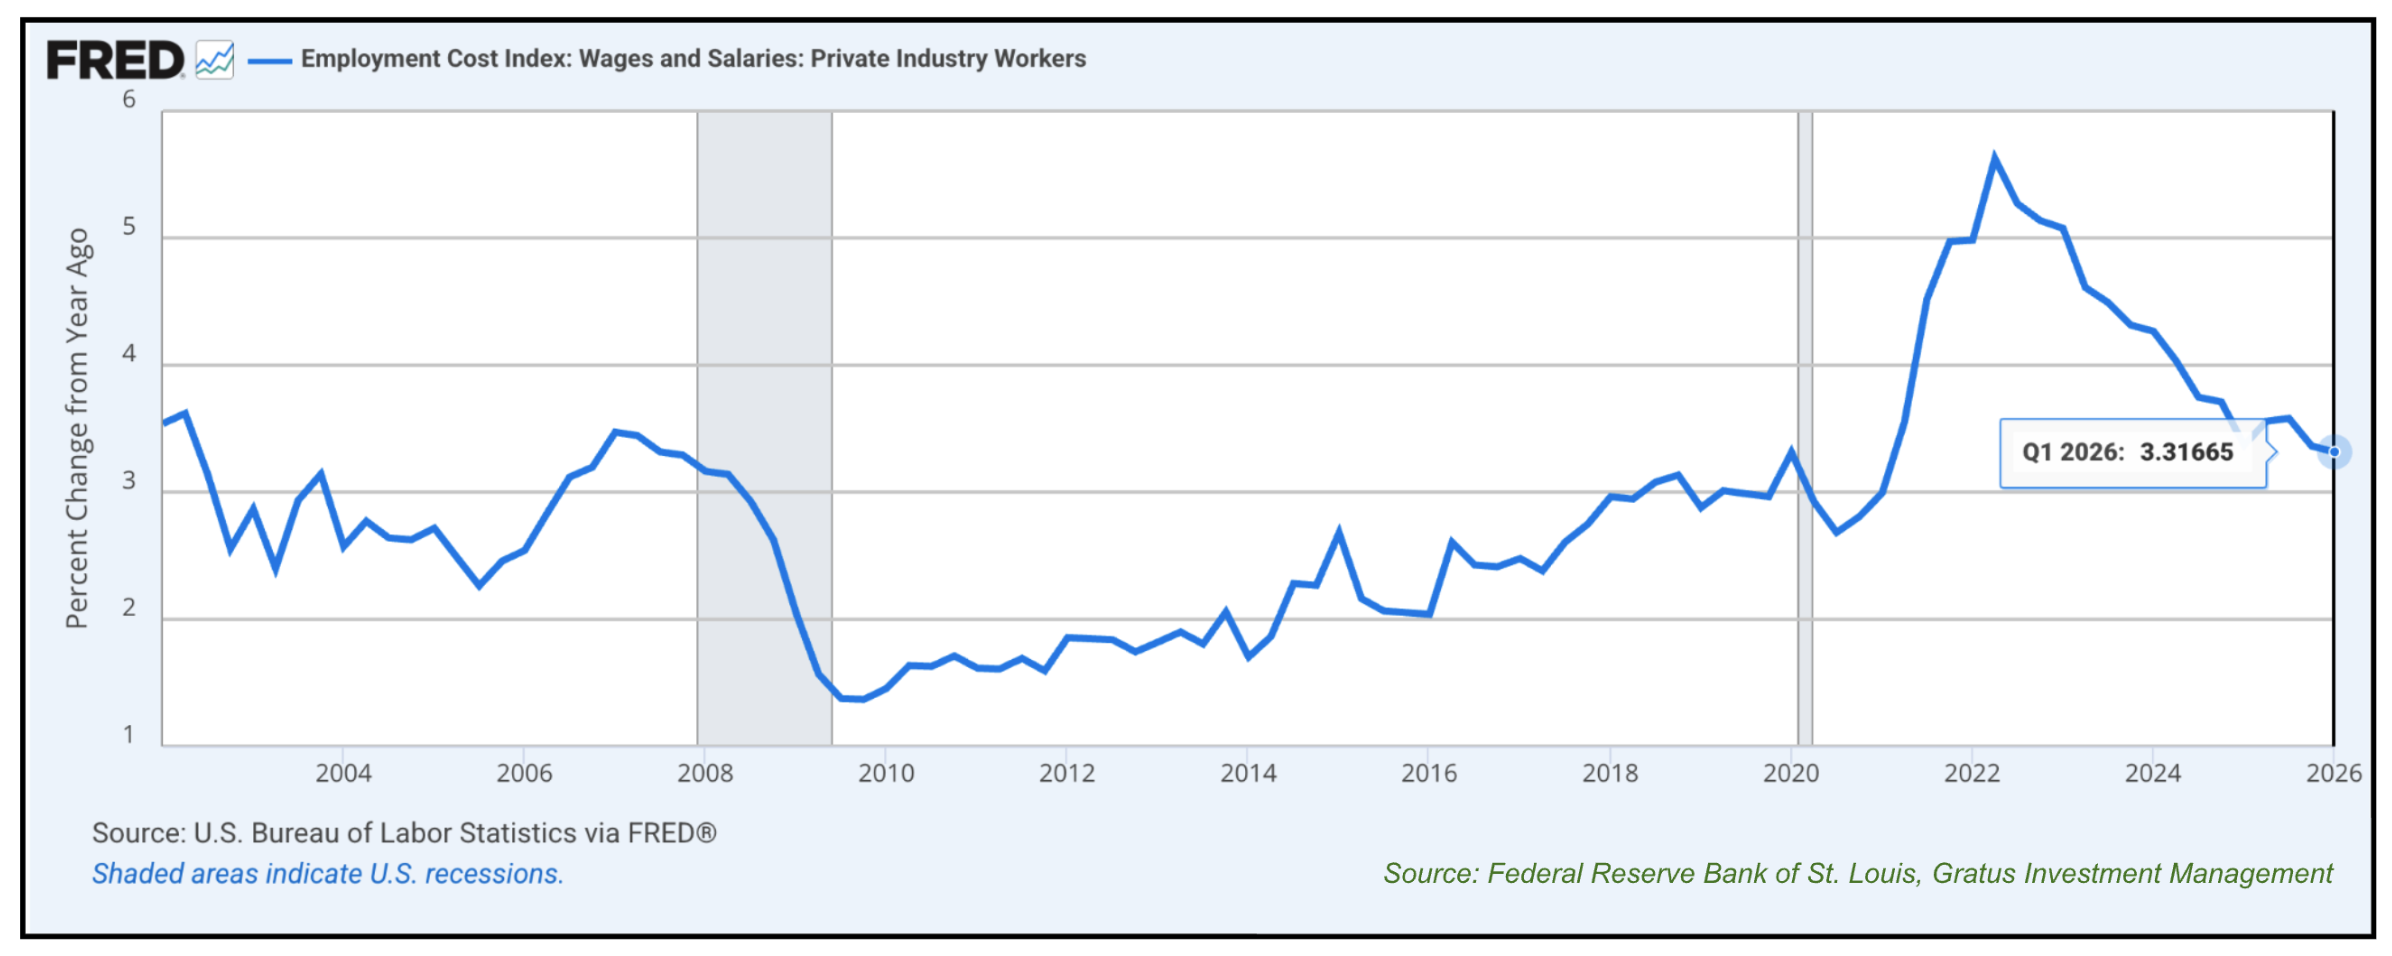
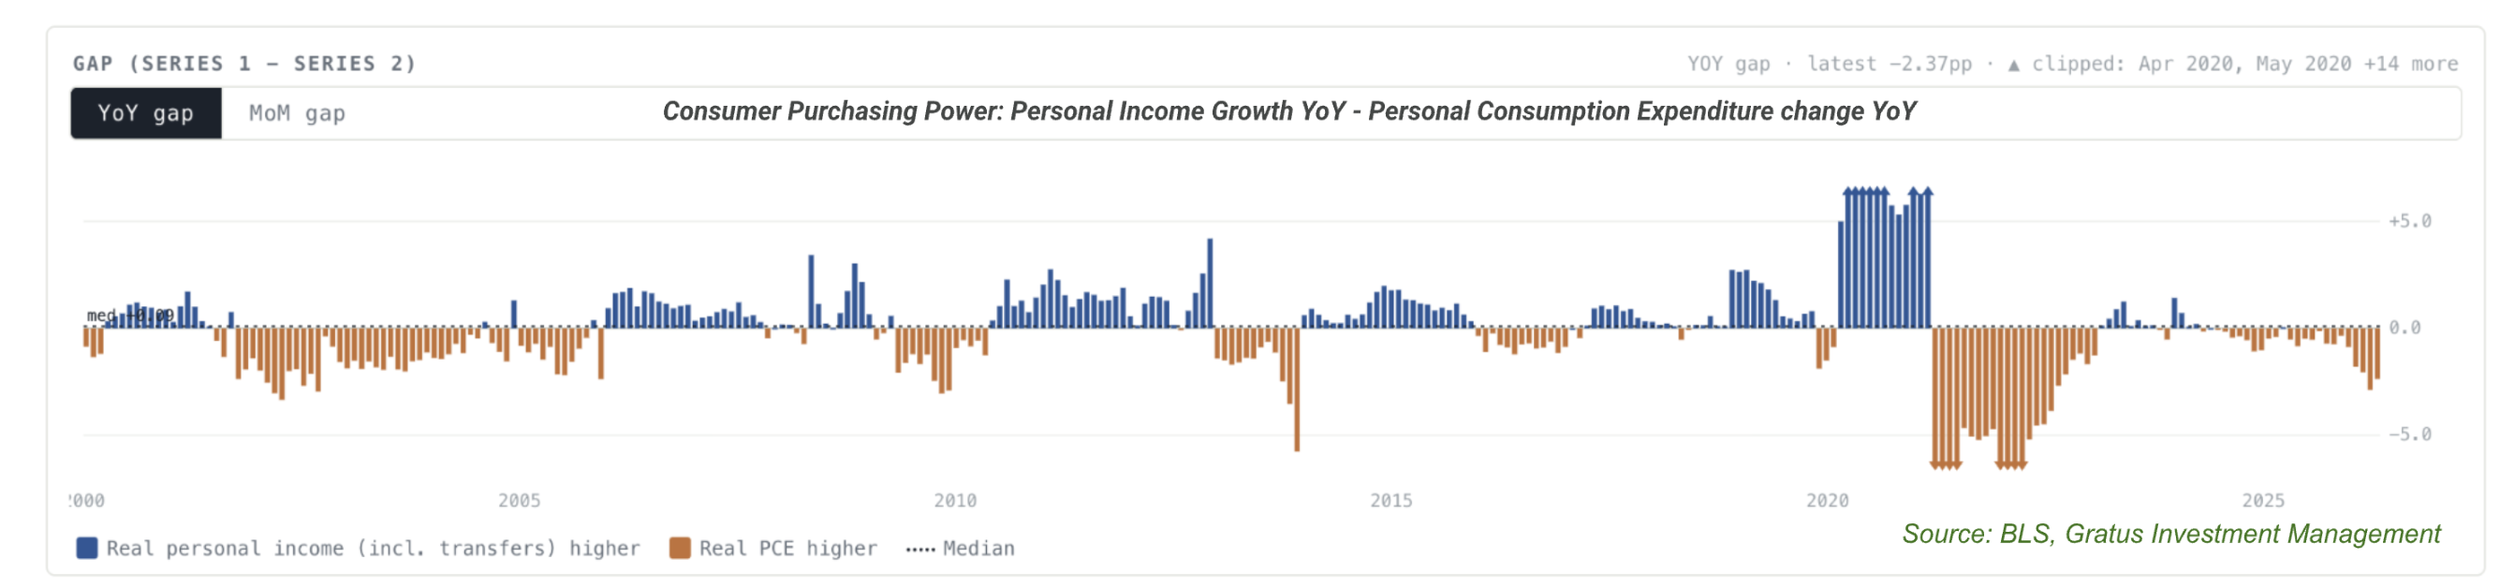
The labor market is not deteriorating, but it is plateauing. While nominal wage growth remains solid (private ECI up 3.3%), real wage growth is eroding when adjusted for energy-driven inflation. The fact that consumption is outpacing income, supported by a savings rate at a four-year low, suggests a consumer increasingly relying on debt to sustain spending.
3. Consumer Financial Health
Consumers' financial conditions are in a good state. Household Debt to GDP is at 68.5%, Debt Servicing Payment to Disposable income is 11.2%, and with a stable job market, consumer credit today is healthier than in 2007. Major banks’ 2Q26 earnings reports confirm our observation with lower credit provisions.
Equity Market Dynamics
Earnings growth will lead, not Valuation expansion
The 2026 rally has been carried by earnings, not by investors paying higher valuation. That distinction matters more than it might seem. Analysts started the year forecasting 1Q26 EPS growth of a modest 14.5%. By the end of earnings season, actual growth had come in at 29.5%, a result few would have called credible in January.
Emboldened, analysts raised their 2Q26 estimate from 18.8% to 23.6%, itself an aggressive number. As of this writing, companies that have already reported are running past even that, with growth exceeding 47%. Energy and discretionary names are benefiting from strong refinery margins and World Cup spending. Consumer credit remains healthy, the labor market is stable, and encouragingly, the wave of AI-related layoffs appears to be reversing; the Wall Street Journal recently reported that companies are hiring again to keep up with AI-driven workloads. Taken together, this is a constructive backdrop for the US economy and for equities.
None of this happens in a vacuum, of course. Decomposing equity returns, as Oxford Economics has done, shows that prices track earnings growth closely over time, but that periods of valuation expansion or contraction unrelated to fundamentals tend to end badly. We saw it in Q1 2003, in 2012 through 2015, and again in 2021 and 2022.

Source: Seeking Alpha
Dot Com Bubble (1997–2000). Valuation expansion did nearly all the work here, and when the bubble burst, returns collapsed by roughly 30%. It is a useful reminder of what happens when price detaches from profit for too long.
Global Financial Crisis (2008–2009). Earnings and valuations fell together this time, which is a far more painful combination than either alone. Total returns dropped below 40%.
Post GFC Recovery (2010–2011). A sharp rebound above 50%, driven initially by an earnings surge rather than a re-rating. The market got the sequencing right that time.
COVID-19 Era (2020–2021). Valuations expanded sharply even as earnings briefly contracted, an unusual pairing that later reversed as earnings growth took over during reopening.
Recent Cycle (2022–2025): A steep valuation contraction in 2022 gave way to a steady recovery through 2024, this time supported by both earnings growth and renewed multiple expansion. In other words, a healthier combination than most of what came before it.
I raise this history because it bears on where we sit today. In 2Q26, the market has entered what looks like a mid-cycle phase, and investors, as they often do at this stage, have begun reaching for the more speculative corners of the opportunity set. That includes not just AI-adjacent technology names but, oddly enough, excavator companies loosely tied to the data center buildout story. Capital has rotated out of the strongest performers and into names offering the appeal of scarcity and a good narrative, with less attention paid to how cyclical that appeal can be. Leveraged retail participation has added fuel to this. Intel is a fair example: the stock has more than quadrupled on thin profits and a still unclear path forward. The story has been compelling. Compelling stories, in my experience, are exactly what one should examine most closely.
Investors have also been drawn to startups like OpenAI, Anthropic, and DeepSeek, all funded by private capital and none of them generating operating cash flow of their own.
Meanwhile, the companies actually producing operating cash flow that funds with serious technological capabilities, and holding more cash than debt on their balance sheets, have been pushed to the side. They are being questioned on their ability to earn back their capital spending or whether they are in the circular finance trick of the minor leagues. I think that concern, while understandable, is largely misplaced.
As equity investors, what excites us is not the debate over who can raise the most capital, but who can build with the cheapest capital, most effectively and hence most efficiently. Big tech, financed by debt rather than by dilutive and costly equity issuance, is in an enviable position. Moreover, Google, Nvidia, and Amazon are not resting on prior success the way some of their 1990s predecessors eventually did. They are leading, and leading at pace, in shaping what comes next.
That pace is worth dwelling on. These companies are innovating at a speed funded almost entirely by their own operating cash flow, a pace that startups, even well-capitalized ones, struggle to sustain, and there are fewer such sponsors around today than there once were. Google and Amazon alone generate roughly $150 billion and $200 billion of operating cash flow each year, respectively, without needing to tap debt or equity markets for growth capital. But when they do call on the debt market, the overwhelming interest allows them to raise debt capital at very low prices in a matter of days.
Compare that to the $60 to $70 billion that OpenAI or Anthropic are seeking to raise through IPO or private markets, and the scale difference becomes hard to ignore.
There is a second thread worth pulling on here. Traditional private equity firms find themselves holding a large inventory of illiquid, unlisted companies with limited flexibility to act. Investors in private equity and private credit are increasingly recognizing that these vehicles have not delivered the risk-adjusted returns, liquidity, or exit paths they were promised.
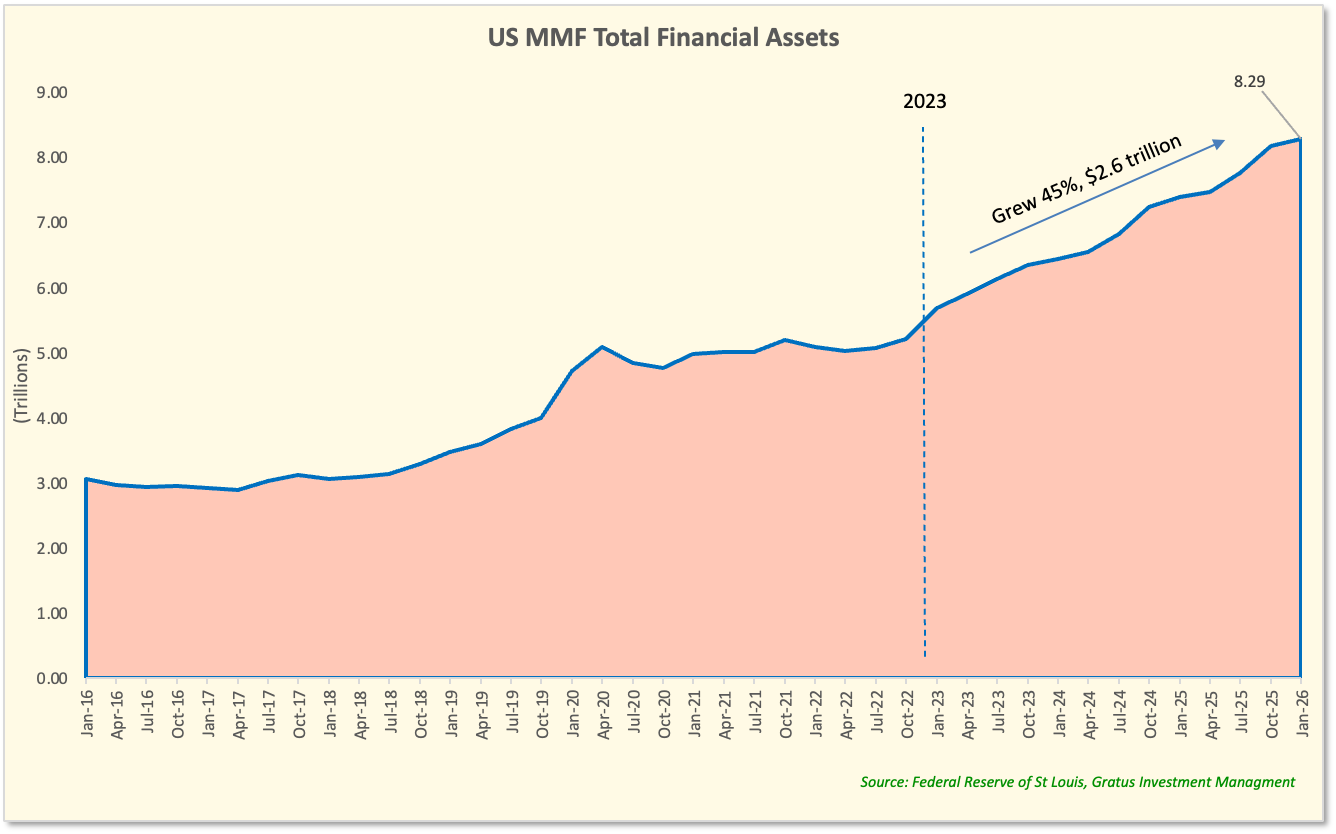
A good deal of new capital from retail and institutions has instead found its way into money market funds, now sitting at $8.3 trillion.
Megacap tech, by contrast, can keep investing, leveraging balance sheets built over years from free cash flow accumulation, at a pace no startup, not even OpenAI or Anthropic, can realistically match. They understand, perhaps better than anyone, that standing still invites replacement. It is, after all, exactly what they once did to the incumbents before them in the 2000s.
Structural Setting favors Equity over Credit
The U.S. equity market's ascent to a $75 trillion valuation is often viewed as a testament to American ingenuity. That is a comfortable story, and comfortable stories are exactly the ones a disciplined observer should be most willing to question. The more useful line of inquiry is not whether this outcome reflects genuine innovation, which it partly does, but whether it also reflects a uniquely favorable alignment of circumstances that may not persist.
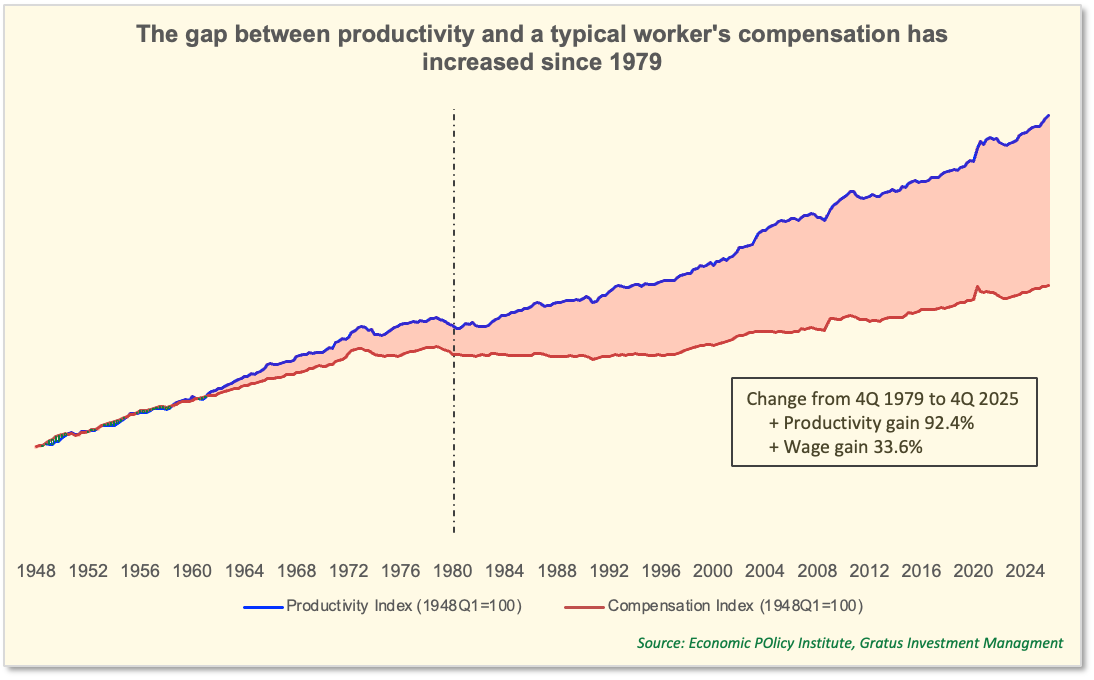
Two forces, in particular, have acted as consistent tailwinds for a very long time.
The first is a persistent decoupling of productivity from compensation. The chart from the Economic Policy Institute makes this point plainly. The gains from improved productivity have flowed disproportionately to shareholders rather than to labor. That effect was amplified as U.S. firms built out global supply chains, pairing American brand equity with the cost efficiencies of Asian manufacturing to expand margins since the 1980s. Labor's share of the value created shrank as its direct contribution to making the product mattered less, relative to the sales, marketing, and brand operations that let companies scale globally on the back of low-cost production overseas.
The second is four decades of falling interest rates, an environment few investors alive today have known the absence of. Falling discount rates mechanically inflate the present value of future earnings, which means a meaningful share of the re-rating investors have enjoyed over that period had little to do with the businesses themselves and everything to do with the discount rate applied to them. It is worth remembering that valuation re-rating of this kind is a tailwind that can reverse.
Put together, we have lived through a multi-decade convergence of margin expansion and valuation re-rating, each reinforcing the other. The question investors face today is not really what drove us here. It is whether either of those forces still holds.
That comes down to two things worth watching closely.
First, whether the global competitive landscape is shifting in a way that erodes the advantage Western brands have held, particularly as Asian brands ascend and increasingly compete on more than just cost.
Second, whether we have simply reached the end of a forty year decline in interest rates, in which case the valuation tailwind that has quietly done so much of the work may no longer be there to lean on.
July Washout
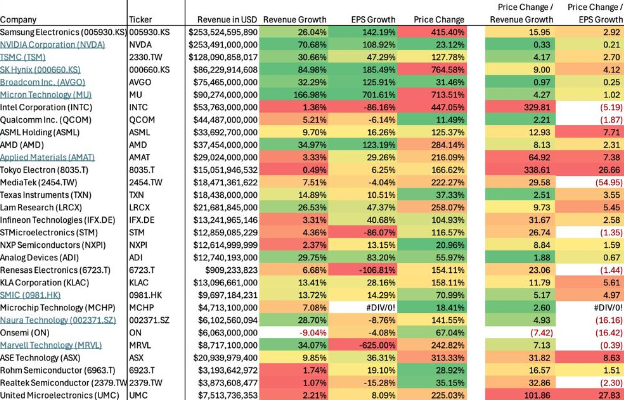
The washout in July is a good cleansing process. The simple table below is a snapshot of market data taken on 2 Jul 26, substantiating our point that some irrational action taken by investors has come home to roost. Very few greens on the dashboard in the right two columns that compare Price Change to Revenue Growth and EPS Growth. Many stocks have risen irrationally more than their revenue growth or EPS growth could justify. The July selloff has lowered the valuation of some blue-chip companies, together with the irrational ones, making it a healthier market.
The Washout Dashboard
Source: Gratus Investment Management
Back to Earnings Growth
In an environment as noisy as this one, we think the single most important thing to watch is earnings growth, not the endless debate over which stocks deserve their price. The numbers, so far, have been telling a clear story.
Some have attributed this strength to a small handful of companies, Micron and Nvidia chief among them, and concluded that the rally rests on narrow foundations. We think that view overlooks quite a lot. Energy, staples, and financials have all performed exceptionally well too, benefiting from high energy prices, elevated commodity prices, and rising interest rates that have directly driven financial sector earnings. Once you account for that, the earnings growth we are seeing looks considerably more broad-based than the concentration narrative suggests.
There are cracks worth acknowledging. Inflation remains elevated, held up in part by the energy shock following the closure of the Strait of Hormuz. But set against that backdrop, earnings growth of this magnitude suggests companies are riding a growth trend with real momentum behind it, one that we believe can plausibly extend another one to two quarters.
There is also a mechanical point worth making about valuation. With earnings growing this quickly, valuation multiples have compressed, not because prices fell, but because the denominator grew faster than the market could immediately re-rate. That is a very different kind of multiple compression than the kind driven by falling prices, and we would argue it does not deserve the same cautious read. As the market catches up to this earnings reality, we expect multiples to re-rate back toward pre-earnings-season levels, which would imply further valuation expansion from here, not the contraction some are bracing for.
Once we get more data points on productivity-driven efficiency and easing inflationary pressure, we are back to the two factors we highlighted that drove the secular trend: productivity gains benefiting shareholders and a benign monetary policy with no hike in sight.
Limits of the old playbook
Before we leave the US segment for China, I want to leave you with some questions that we continue to ask ourselves.
Will the market learn to function without a lighthouse in broad daylight?
The market's reaction to Chairman Walsh's recent press conference was telling. A good portion of the trading community looked, briefly, like it had lost its lighthouse. After fourteen years of forward guidance dating back to Chairman Bernanke's post-GFC era, analysts and traders grew accustomed to treating the Fed as a proxy for economic assessment itself, and over time, that habit drifted further still, into something closer to reading the personal biases of individual Fed governors. Chairman Walsh removing that reliance is, in our view, a healthy development. The market should form its own opinion about the economy rather than living in the Fed's shadow. But old habits die slowly, and it will likely take months, if not years, before some participants fully adjust.
Is productivity-driven earnings expansion sustainable as AI adoption spreads?
We believe it is, and that it will prove transformative well beyond the technology sector itself. Companies that adopt AI meaningfully into their operations should pull ahead, while those that lag risk being driven toward irrelevance. This is less a story about tech companies than about which companies, across every sector, choose to become adopters.
Contrary to the widespread assumption that AI adoption would trigger employment distress, an industry expert with deep technology and operations experience told me in June that this narrative is fundamentally flawed. Rather than displacing workers, increased AI integration allows enterprises to free up human capital for high-value, strategic tasks previously sidelined by time constraints. Furthermore, enhanced productivity expands organizational throughput, which inherently generates a greater absolute volume of operational anomalies requiring critical human judgment. Consequently, corporate hiring will rebound.
How does the closure of the Strait of Hormuz affect the case for U.S. manufacturing home-shoring?
We think the effect compounds in America's favor. As Asian factories contend with higher energy costs and less stable supply chains, the relative case for reshoring production closer to end demand grows stronger, and we expect this pressure to build rather than fade.
Is the competitive landscape shifting against U.S. incumbents more structurally than headlines suggest?
This may be the hardest question of the five. An increasing number of Asian enterprises are proving both genuinely innovative and highly price competitive, not merely cheap. The evidence spans electric vehicles, frontier AI models, and by some counts, more than sixty other critical technology areas where China now holds a leadership position. The question this raises is uncomfortable but unavoidable: will the world choose to consume at China's price or at the West's? For the Global South, the answer is not really in doubt. For Volkswagen, Mercedes, and BMW, it is not much more ambiguous either. The harder question is whether governments will accept the same conclusion their own companies appear to have already reached.
Are U.S. youth quietly voting on the return to education with their feet?
It is worth asking whether younger cohorts have started to recognize a weakening return on the traditional education path, and are responding by leaving school earlier to try their luck in financial markets, prediction markets, and similar venues instead. If that pattern is real rather than anecdotal, it carries implications for the future composition of the knowledge worker pool that go well beyond any single market cycle.
We remain skeptical of simple trend line projections, however tempting they are in a market that has rewarded exactly that kind of thinking for so long. The answers to these five questions, more than any near term data point, will determine whether the conditions that fuelled the last forty years are genuinely behind us, or merely resting. It is against that uncertainty that we turn next to credit, where the risk-reward setup looks considerably less favorable than in equities.
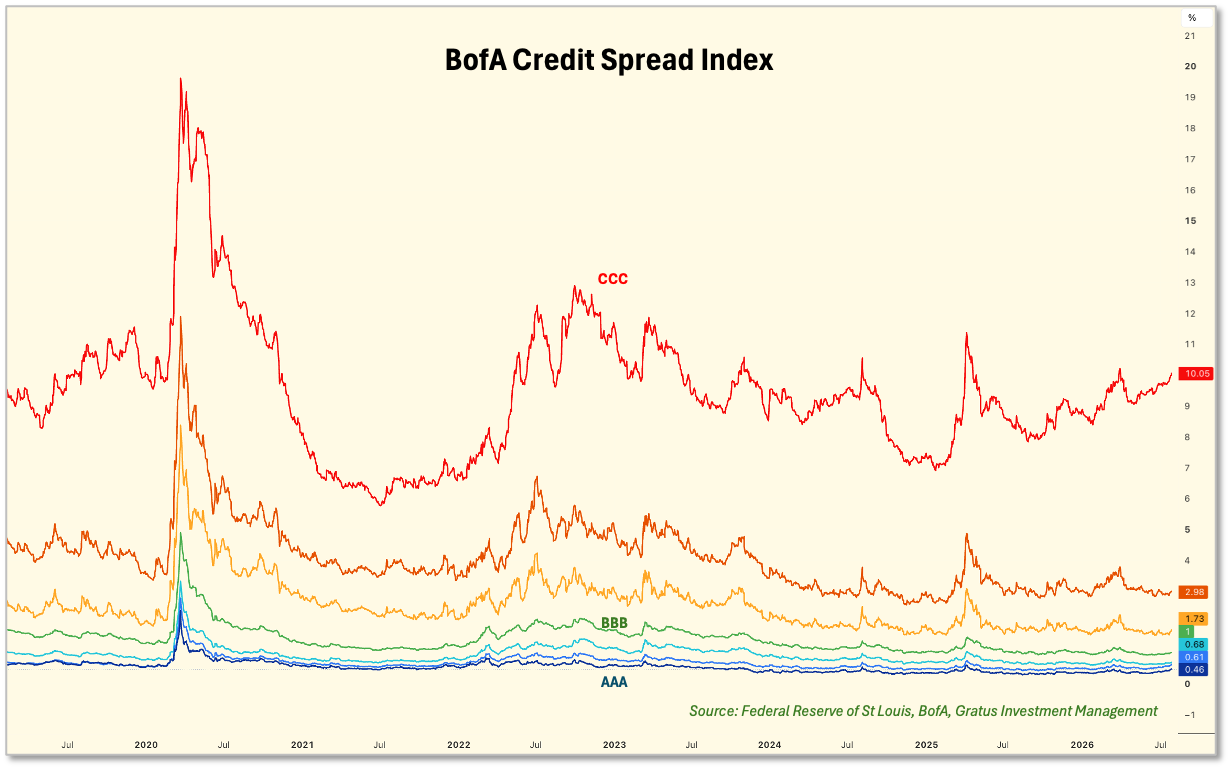
Credit Offers Risk with No Return
On the credit front, the market remains extremely expensive despite increasing debt issuance from the tech sector, as traditional credit investors and Banks have substantial amounts of dry powder, and the $7 trillion of funds in money market funds provide an additional source of liquidity for credit.
Turmoil continues in private credit, but we think the scale of the problem remains contained for now, at least until delinquencies rise meaningfully among the disrupted, unlisted software companies most exposed to this cycle. That is the story worth watching, not the headlines.
Valuation, Trends and Structural Risk
The US equity market’s rise to a $75 trillion valuation rests on two pillars: sustained productivity gains and a multi-decade decline in interest rates. We maintain a structural preference for equities over credit. The current concentration risk is undeniable.
The recent broadening of the market, fueled by investors venturing into higher-risk segments with leveraged expectations for rapid gains, precipitated the July Washout. This correction serves as a healthy cleansing process, filtering out speculative forces. Consequently, it presents a compelling opportunity for investors to invest in premier, high-quality enterprises possessing robust competitive moats at highly attractive entry prices.
Crucially, we are encouraged by the priority tech leaders are placing on capital expenditure over share repurchases. This strategic focus indicates that industry pioneers see immense, unprecedented opportunities ahead. Over the past decade, these seasoned executives have demonstrated exceptional capability and reliability. Navigating seamlessly through macroeconomic storms, they have built mega-cap enterprises delivering rapid annual growth of 15% to 20% while accumulating hundreds of billions in free cash flow. Backed by an established track record, deep technological expertise, and robust balance sheets capable of financing continuous innovation through debt, this traditional growth framework yields superior return on equity. Consequently, equity investors should favor this genuine innovation over the artificial support of financial engineering.
Nevertheless, we remain cautious regarding the speculative surge in AI-related sectors, which has pushed valuations to unsustainable levels. To mitigate this risk, our disciplined macro screening process systematically filters out these markets, targeting their inherent structural vulnerabilities, limited liquidity, and high concentration of economic activity.
The Bottom Line
Operating in a climate of heightened political and geopolitical risks, our primary approach for 2H26 will be to proceed with caution. Unlike 2022, the economy is not flashing red and the system is no longer flooded with easy money. Nevertheless, we recognize that sustaining a "stable" outlook depends entirely on preventing a multitude of emerging risk factors from deteriorating.
Absent these risks,, the US is bordering Goldilocks, steady growth with manageable inflation, balanced monetary condition and steady job market.
Energy Special
What if America restricts energy exports?
Restricting or banning energy exports is politically expedient and, on the surface, popular. It is unlikely, however, to bring lasting relief, and it would come with substantial market distortion along the way. We lay out why this move would likely do more harm to the United States than good.
A Geopolitical Standoff Without an Easy Exit. The conflict in the Strait of Hormuz remains a primary source of volatility, with the U.S. and Iran entrenched in a standoff that keeps global energy prices elevated. That backdrop alone makes any domestic policy response higher stakes than usual.
The Risk of Political Myopia. That said, the political calculus could shift quickly. With no clear solution in sight for elevated domestic gasoline and diesel prices, some commentators have floated export restrictions or outright bans as a possible response. We think this would be a mistake, for reasons that go beyond politics.
A Structural Mismatch in U.S. Infrastructure. The core problem is a mismatch between what the U.S. produces and what its refineries are built to handle. Domestic refining capacity is largely configured for heavy, imported crude, while domestic production, concentrated in shale basins like the Permian, is overwhelmingly light, sweet crude, known as West Texas Intermediate. The U.S. is currently a net exporter of petroleum products, accounting for roughly 11% to 13% of global supply. Restricting exports would not resolve this mismatch. It would simply create a bottleneck, since domestic refiners cannot absorb unlimited volumes of light crude without compromising yield and efficiency, and storage capacity is limited.
Economic Consequences: There are several layers of consequences:
The first layer is upstream: an export ban traps light sweet crude domestically, storage fills, and producers are ultimately forced to shut in wells. The policy's stated intent is to help domestic producers, yet the practical result would be the opposite, WTI prices collapsing relative to global benchmarks as the crude has nowhere left to go.
The second layer runs through refined products, and here the irony sharpens further. If restrictions extended beyond crude to refined products, Gulf Coast refiners would likely cut throughput to defend their own margins rather than flood a suddenly captive domestic market. Prices for refined products might dip temporarily along the Gulf Coast as a result. But the East and West Coasts, which rely far more heavily on imported fuel, would feel the opposite effect, facing higher prices as global product markets, now missing U.S. supply, tighten further.
The third layer is natural gas, produced alongside oil in the same wells. Shut in E&P activity does not just stop oil production, it stops associated gas production too. The result would likely be a spike in domestic power and heating costs, an outcome no administration would welcome heading into a midterm election, and a fairly direct contradiction of the relief the policy was meant to deliver in the first place.
Global Market Disruption: Pulling U.S. barrels out of the global market would trigger meaningful price distortion internationally, and it would hand an opening to competitors like Russia and OPEC+ to capture market share the U.S. currently holds. And because the U.S. remains a major importer of finished goods, it cannot really insulate itself from the higher energy costs that would eventually ripple back through global supply chains, offsetting whatever localized savings the export restriction was meant to deliver.
Who Benefits in the Short Run: The Integrated Majors
Integrated oil majors, Chevron and ExxonMobil among them, are structurally positioned to benefit from exactly this kind of mismatch today, exporting surplus WTI at a premium while importing cheaper heavy sour crude for domestic refining. During the recent conflict, these majors saw refining margins run two to three times above historical averages, with diesel margins briefly approaching $70 per barrel. That downstream strength has provided a meaningful offset to any regional production losses elsewhere in their business.
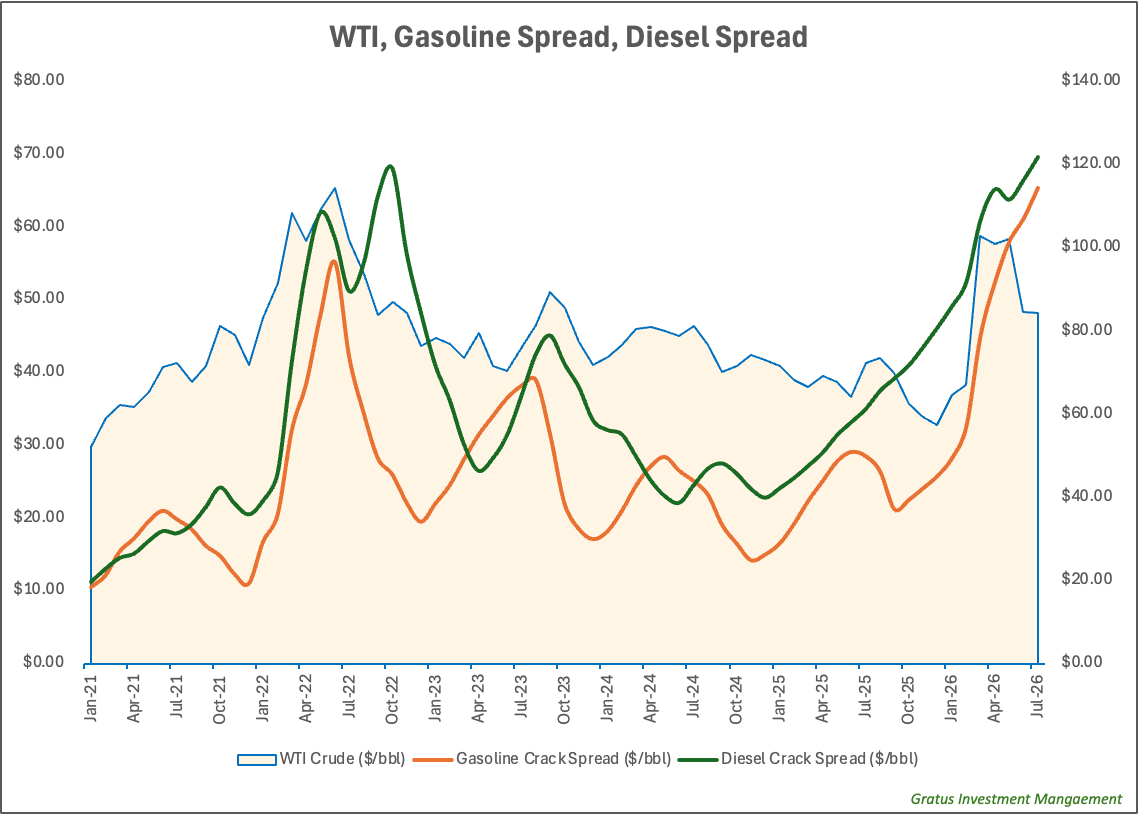
Conclusion
While the economic benefits of an export restriction may look optically attractive and bring some short-term relief, the reality looks messier. The notion that the U.S. is a net-oil exporter and is thus more insulated may sound romantic until one looks at the actual energy mix. The U.S. being a net oil exporter means it benefits from high oil prices as a producer, but that’s a financial/trade story, not an energy security story. What actually determines vulnerability to oil shocks is how much of your domestic energy consumption runs on imported oil – and the U.S. still imports crude oil, while its domestic refinery infrastructure and law retards a smoother flow of refined products to equalize geographical price imbalances. The broader lesson is that energy security and managing price stability are really about diversification of sources more than imposing trade bans. America can be an oil exporter and still be deeply exposed if oil dominates its own consumption mix. True security relies on diversifying energy sources rather than imposing trade bans.
China Outlook
Consumer Psychology vs Health
Chinese consumer psychology remains firmly in a defensive posture. Uncertainty stemming from world events, ongoing weakness in domestic real estate, and growing concern about being displaced by AI have all contributed to a personal savings rate that has climbed to 37.6% of GDP. This increase appears driven primarily by precautionary saving, slow real income growth, and an effort to rebuild wealth lost through real estate.
Disposable Income
In 1Q26, nationwide per capita disposable income reached ¥12,782, a nominal increase of 4.9% year on year, and a real increase of 4.0% after adjusting for prices. Urban households continue to earn more in absolute terms, but their nominal income growth actually lagged rural households, 4.2% versus 6.1%. Because urban inflation runs higher than rural inflation, that gap widens further in real terms: urban real disposable income grew 3.2%, compared to 5.4% in rural areas.
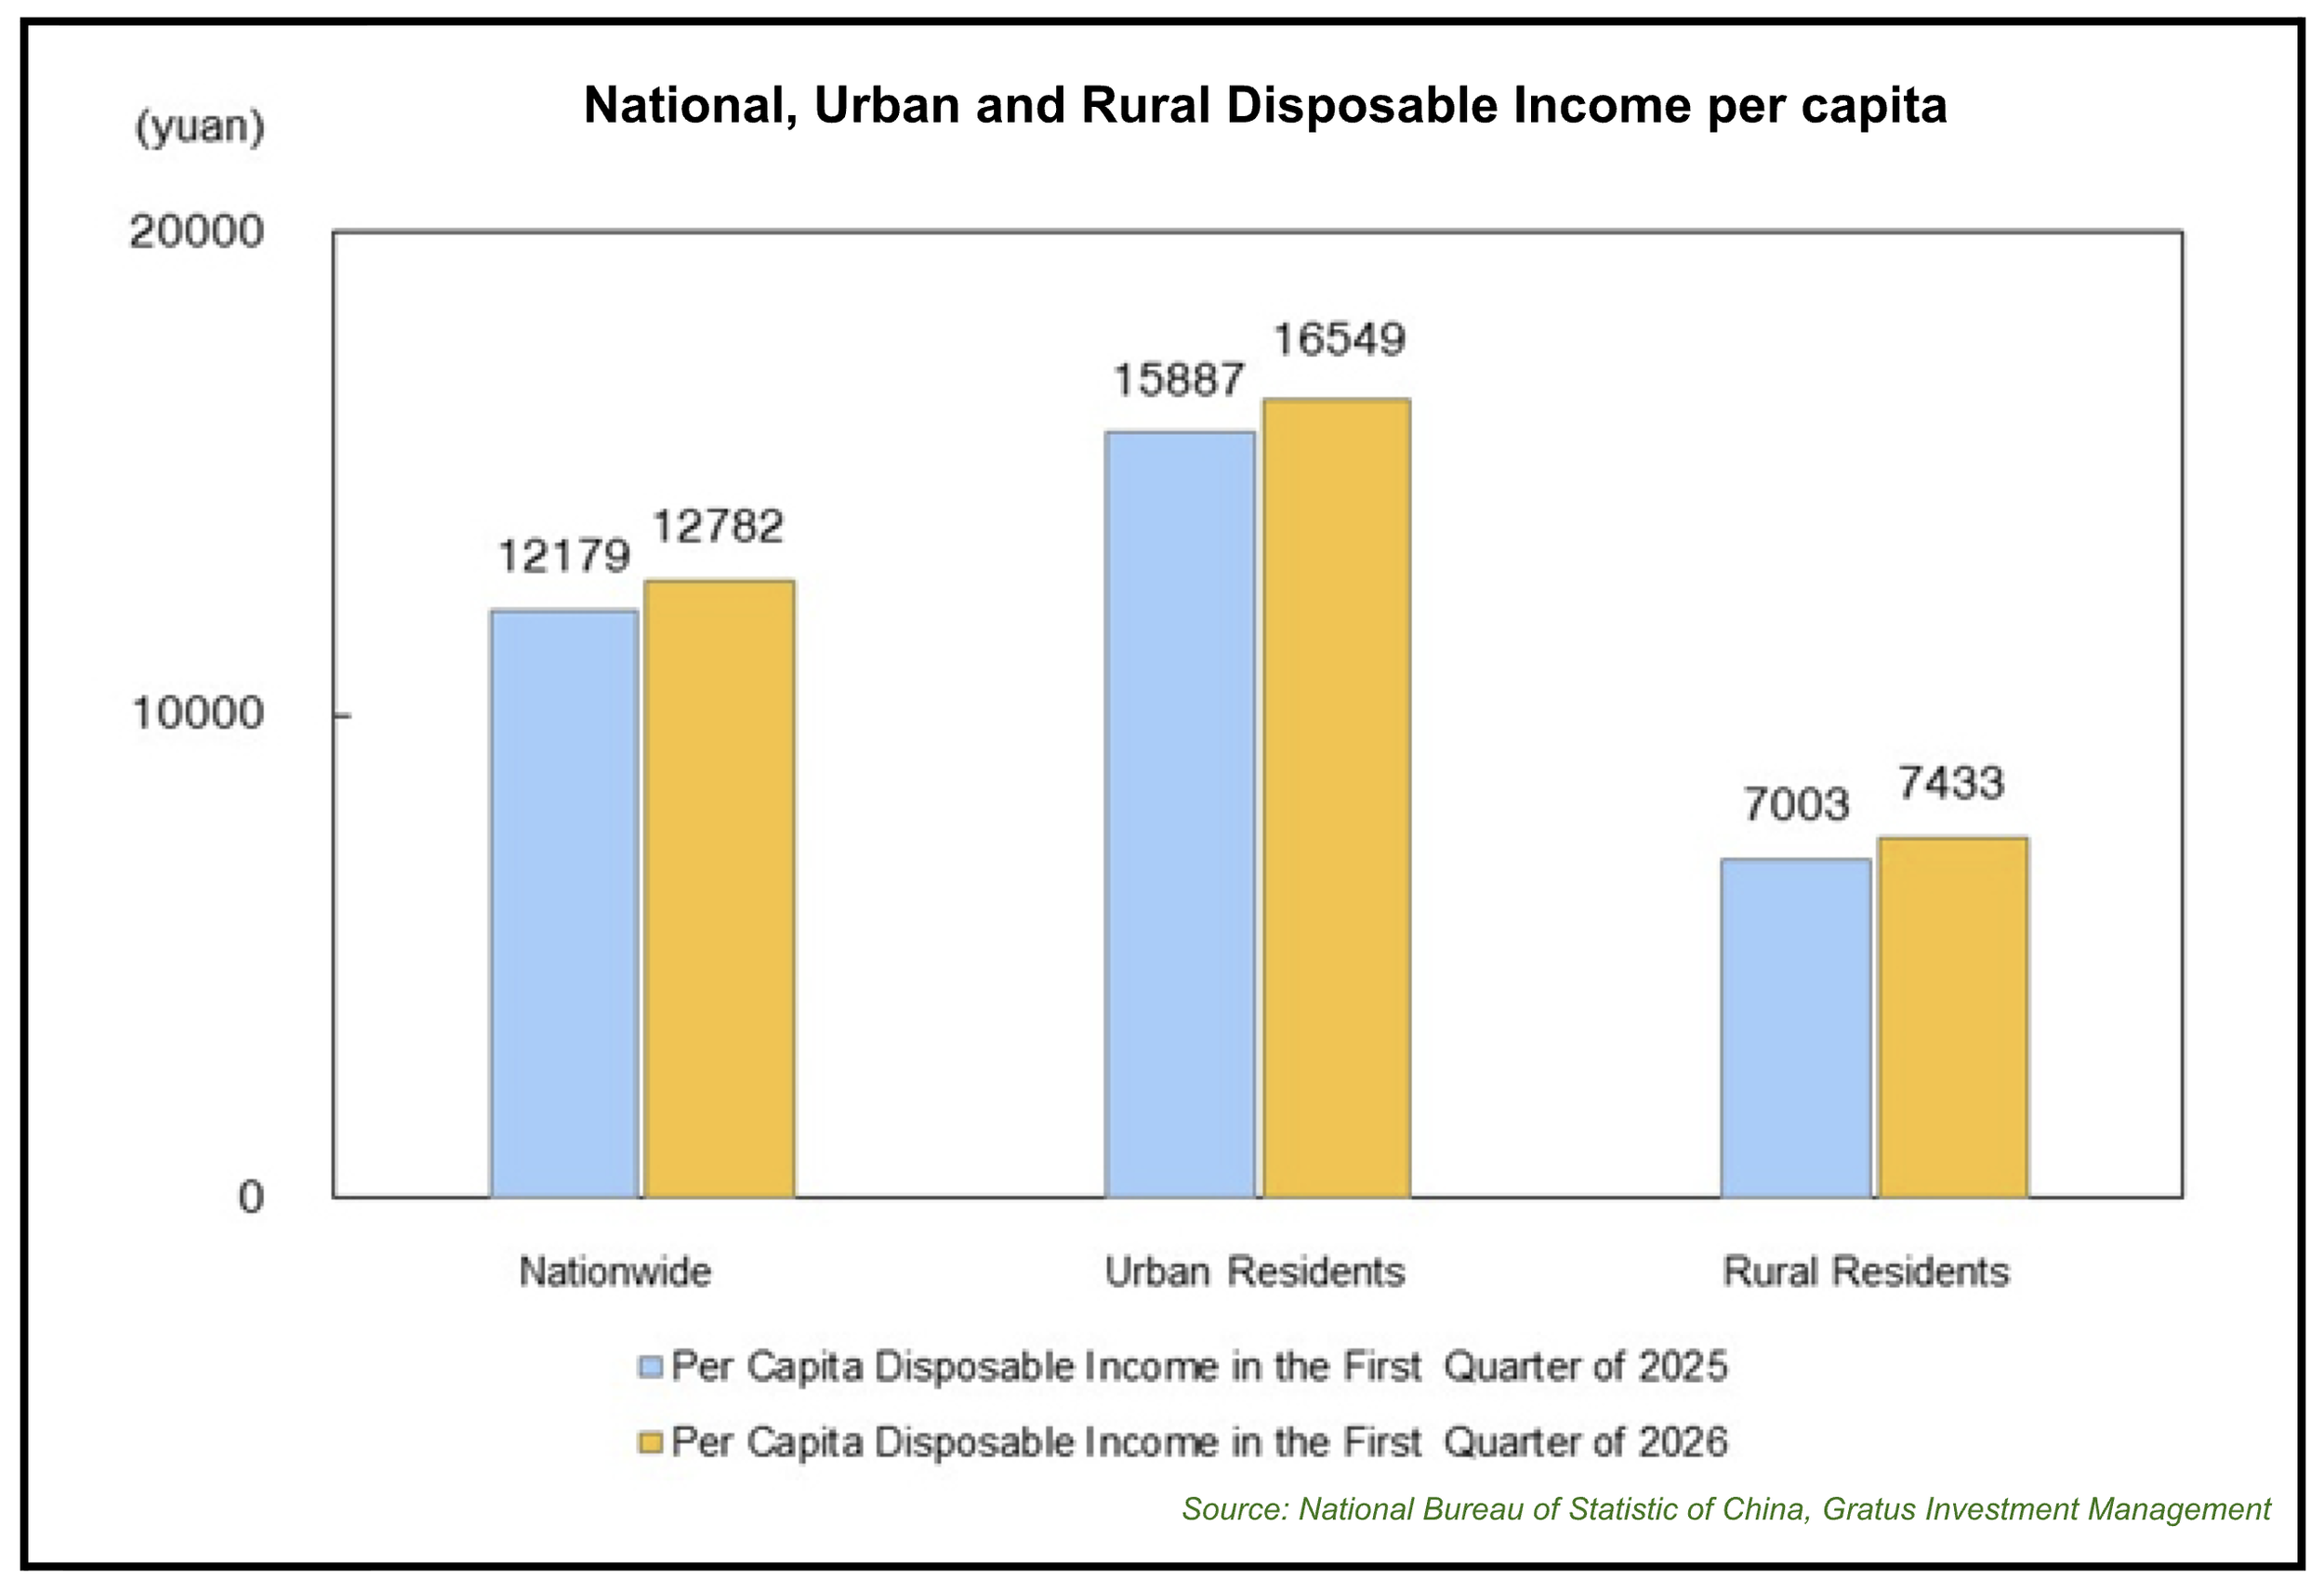
Disposable income breaks down into the following income categories:
Wages had a nominal increase of 4.9% and formed 57.3% of disposable income;
Business income rose 6.6% and is 17.3% of disposable income;
Property income grew slightly by 1.6%, accounting for 8.1% of disposable income;
Wealth transfer increased 5.1%, accounting for 17.4% of disposable income.
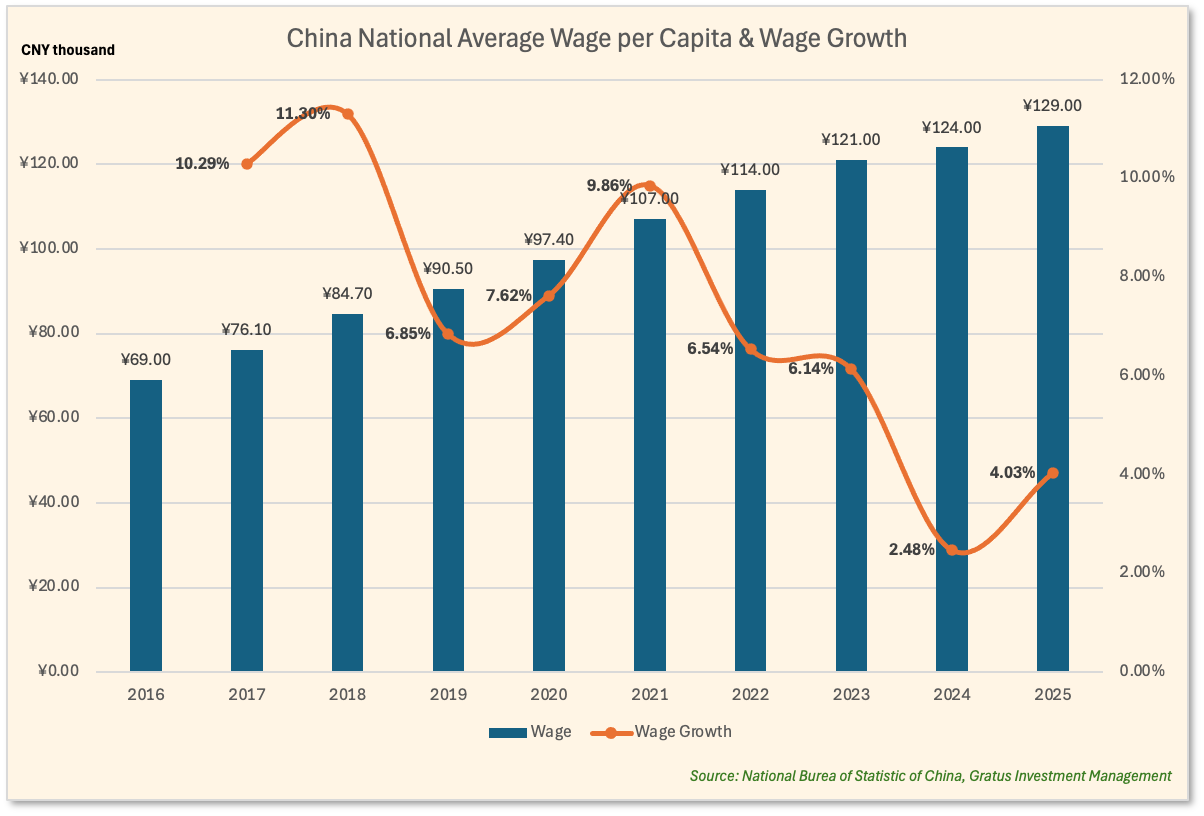
Income Growth Deceleration: Slowing disposable income growth over the last 10 years appears to be reinforcing a protective frugality over discretionary spending.
Personal Consumption Expenditure
Against this uncertain environment, spending has come in even softer than income itself. Nominal personal consumption expenditure grew just 3.6% year on year, and only 2.6% in real terms. Urban areas saw a particularly muted real increase of 2.0%, while rural areas fared somewhat better at 3.7%.
Saving Rates
The weak consumption has seen a corresponding surge in savings. Total household savings and bank deposits rose by ¥7.58 trillion in 1H26, roughly US$1.08 trillion, keeping the total near record highs above ¥160 trillion, or around US$22 to US$23 trillion. That said, this increase was notably smaller than the previous year, where ¥10.77 trillion was added in 1H25.
That gap is not, in our view, evidence of consumers spending more. It looks instead like a reallocation into equities. Deposits with non-bank financial institutions (NBFI) rose by ¥4.65 trillion in 1H26, a pace considerably faster than the ¥6.41 trillion added across all of FY2025, and well above the ¥2.55 trillion added in 1H25. The timing lines up neatly with the onshore equity market's strong recovery in 2Q26, which we doubt is a coincidence.
Adding that NBFI difference, ¥4.65 trillion versus ¥2.55 trillion, back into the 1H26 bank deposit figure of ¥7.58 trillion brings the total to roughly ¥9.68 trillion, only marginally below the ¥10.77 trillion recorded in 1H25. In other words, households are not saving meaningfully less and spending more than they were a year ago. They are simply directing a larger share of that savings into equities rather than bank deposits.
In conclusion, consumerism remains structurally weak, and precautionary saving continues to define household behavior. The one shift worth flagging is where that caution is being parked, increasingly in equities rather than cash, which says as much about the state of confidence as the savings rate itself does.
Government consumerism initiatives
For consumption to recover, consumer confidence needs to recover first. Saving for a rainy day is a deeply Asian cultural habit, and the relationship tends to run in one direction: the higher the anxiety, the higher the savings rate.
Reviving consumer confidence is now an explicit government priority, aligned with the 15th Five-Year Plan's agenda around human resources and social security. Beijing has laid out several concrete initiatives aimed at this goal.
Broadening Unemployment Insurance and Job Matching
Unlike the US model, China's unemployment insurance system is funded by employee and employer contributions. The length of contribution history would determine the benefits. Someone with ten years of contributions receives meaningfully more support than someone with just one. Several extensions to the program are worth noting.
Employer refunds and Youth Hiring Subsidies: The Job Retention Refund Program refunds companies a portion of the unemployment insurance premiums they paid the previous year, provided they avoid layoffs. Companies hiring recent graduates or workers aged 16 to 24 can also receive a one-time subsidy per new hire, a fairly direct attempt to address youth unemployment specifically.
Gig Worker Coverage: Coverage is also being extended to gig workers, including ride-hailing drivers and food delivery couriers, through a targeted work-related injury insurance pilot. It is worth noting that gig and migrant workers are currently covered at meaningfully lower rates than resident workers, so this is a gap being closed rather than a new benefit created from scratch.
Integrating Migrant Workers: The government is also working toward universal coverage, eliminating the historical distinction that once excluded rural migrant workers from paying into the fund at all, and integrating them under the same rules as everyone else. The stated goal is 255 million people enrolled in unemployment insurance by 2030
Reemployment Targets: The system will continue to expand its policies to support jobs and skills. This also includes working to reemploy 25 million laid-off workers and help another 6.5 million people facing employment difficulties find jobs during the period.
Consumer Revival Strategy
Beyond the labor market, China has taken a genuinely new step: in July 2026, the State Council approved the first national, five-year plan ever dedicated specifically to expanding consumption.
Beijing has set a target of roughly ¥60 trillion in total annual retail sales, or about $8.8 to $9 trillion, by 2030, as the centerpiece of this broader shift toward a domestic consumption led economy.
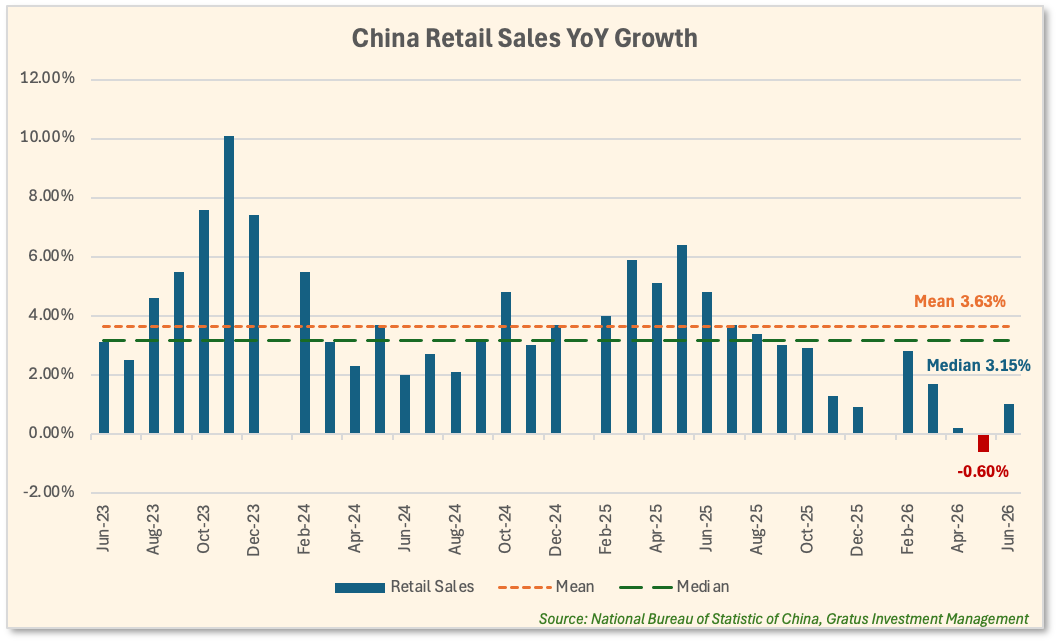
That target implies annual retail growth of about 3.7%, a meaningful step up from where things currently stand. Retail sales growth has averaged just 1.02% year over year over the past six months, so closing that gap back toward the historical mean would go a long way toward stabilizing retail employment, which has been a quiet casualty of the recent slowdown.
The first consumption blueprint rests on three connected pillars:
Services over goods. The plan prioritizes elderly care, childcare, healthcare, culture, tourism, sports, and education. This is not really optional. The demographic consequences of the one-child policy are now arriving in the form of a rapidly aging population, which will require substantially more public care infrastructure.
Raising income's share of the economy. Beijing has pledged to “raise household incomes and 'significantly' increase household consumption's share of the economy from around 40% at present”.
Reviving physical retail. Authorities are pushing to upgrade traditional commercial districts and make bricks-and-mortar stores more immersive to protect them against intense e-commerce price competition.
Taken together, we view this trajectory as broadly supportive of stable economic growth over the next several years.
Enterprises
Manufacturing Focuses on the Export Market
Manufacturing and industrial companies performed exceptionally well in 1H26. According to the National Bureau of Statistics, profits reached ¥3.95 trillion, up 18.7% year on year. State-owned enterprises (SOE) contributed ¥1.31 trillion of that, up 17.9%, while private enterprises (POE) grew faster still, posting ¥3.04 trillion in profit, up 24.7%.
With domestic retail sales weak, enterprises have leaned into exports instead, and the results have been strong. China's export demand overseas remains robust, underpinned by genuine improvements in product innovation, quality, and price competitiveness. EV exports surpassed one million units, up 70%. Semiconductor exports surged 122%, computer parts grew 53%, and ship equipment rose 42%. It is worth noting ASPI's assessment from late 2025, which placed China as the leader in 66 of 76 critical technology categories, a scale of technological leadership that helps explain why this export strength looks structural rather than cyclical.
That export strength flowed through to manufacturers and their upstream suppliers, several of which posted standout results. Smelting and pressing of non-ferrous metals grew 99.4% year on year. Computers, communication equipment, and other electronic equipment rose 96.9%. Raw chemical materials and chemical products increased 67.8%. Coal mining and washing grew 41.1%, and petroleum and natural gas rose 16.6%.
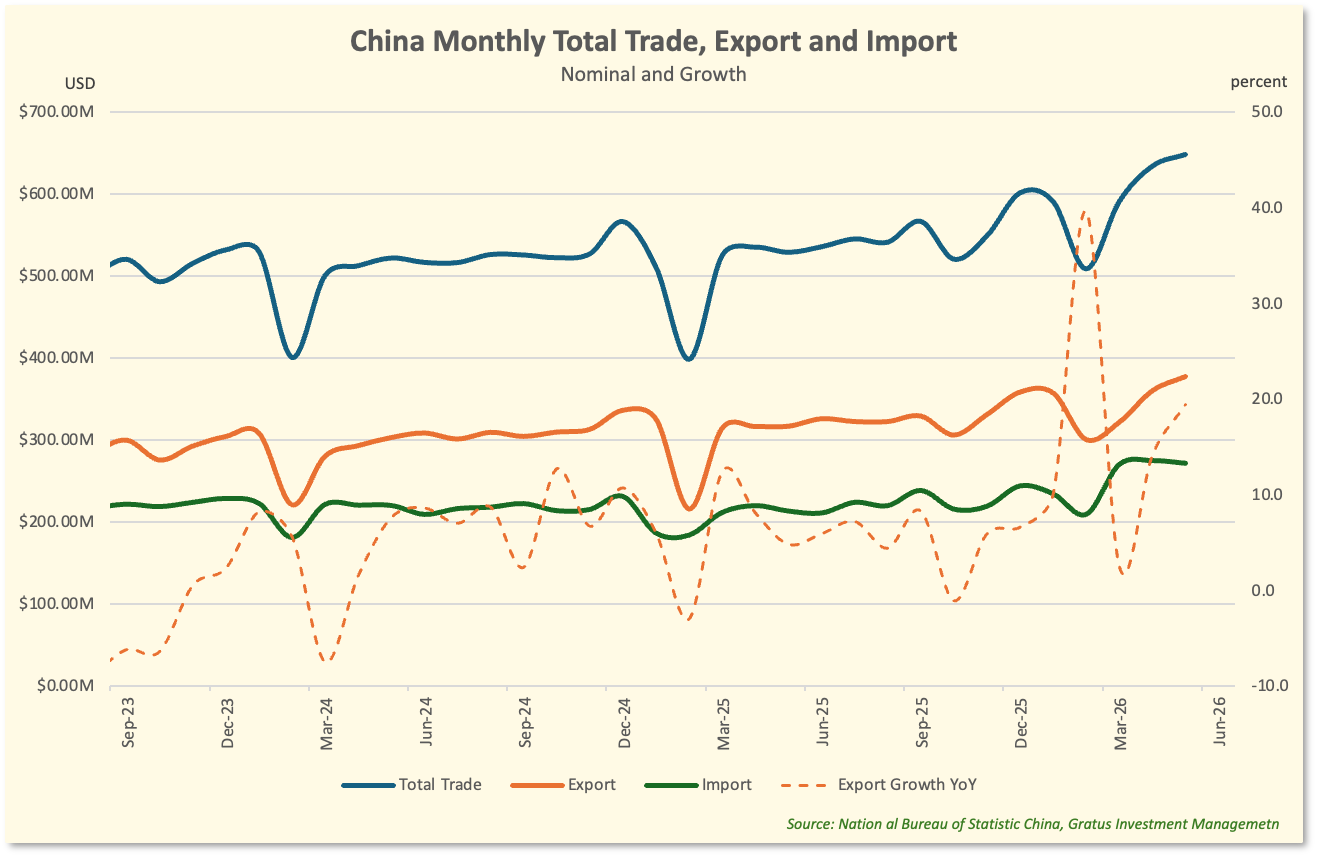
The picture is considerably weaker on the domestic side, reflecting soft consumer demand and continued real estate weakness. Processing of food from agricultural and sideline products fell 12.0%. Automobiles declined 19.5%. Smelting and pressing of ferrous metals dropped 25.0%, and non-metallic mineral products fell sharply, down 47.8%.
The automobile sales weakness in particular deserves attention, because it is large enough to distort the broader picture on its own. Automobiles make up roughly 10% of all retail spending in China, so a 19.5% collapse in that single category acts as a heavy mathematical anchor on the entire retail figure. Blended against otherwise modest growth elsewhere in the economy, it alone drags overall retail growth down by roughly 0.6 percentage points. In other words, the export-led strength in manufacturing has been real, but it has not been enough to offset what a single struggling category can do to the aggregate numbers.
Notwithstanding internal headwinds, enterprise cash generation remains demonstrably robust, catalyzed primarily by export-oriented manufacturing strength. While domestic consumption continues to be the pivotal macroeconomic variable, sustained international demand for Chinese goods has effectively bolstered enterprise-level free cash flow. Reflecting this acceleration, deposits held by non-financial enterprises expanded by ¥3.2 trillion during 1H26. This outpaces the ¥1.77 trillion increase recorded in 1H25 and exceeds the ¥2.31 trillion cumulative growth for the entirety of FY2025. Such substantial deposit expansion indicates that commercial entity cash flows have improved materially relative to the prior year.
Equity Capital Market Transformation
The Substantial Increase in Household Participation
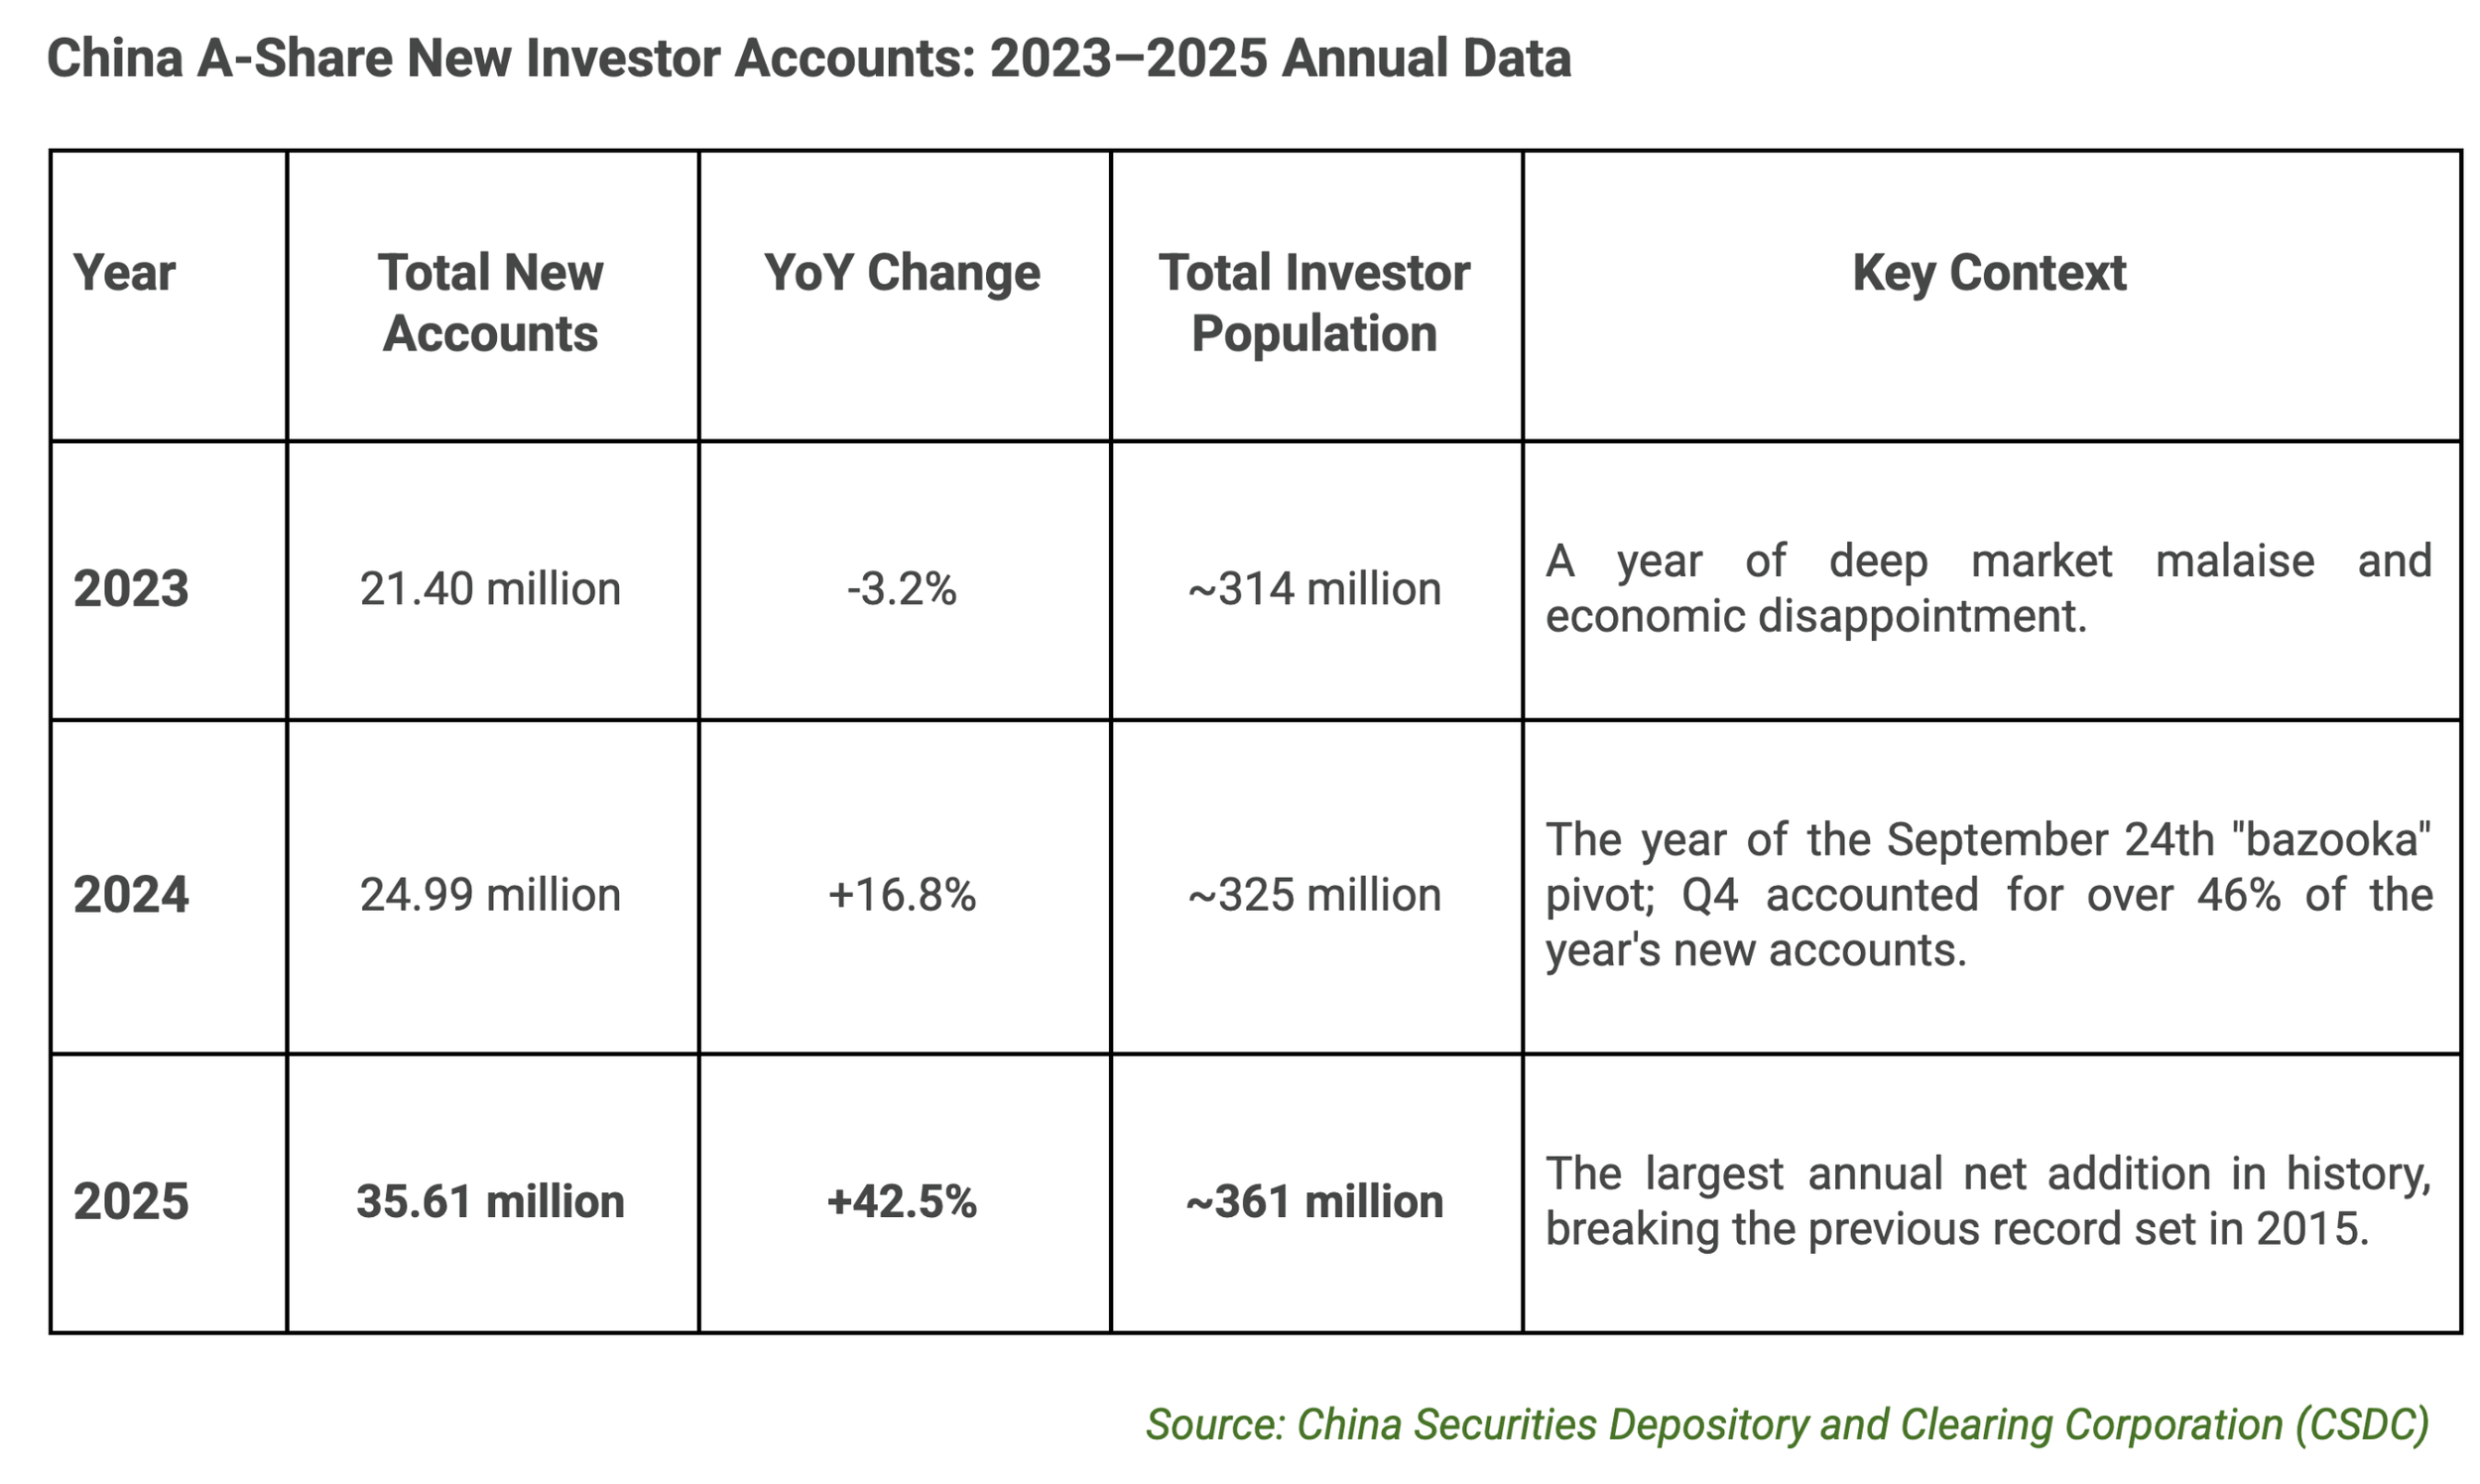
China's onshore equity market has seen a dramatic, historically significant surge in household participation, with new account openings exploding almost overnight starting in late September 2024. Data from the China Securities Depository and Clearing Corporation shows a market that went from dormant to frenzied in the span of weeks.
Through early 2024, monthly new account openings were sluggish, averaging around 1.0 to 1.5 million, consistent with a market still working through a period of malaise. The inflection point arrived in September 2024, when a major policy stimulus pushed new account openings to 1.83 million, a 37% jump from August.
That stimulus came from a rare joint press conference in which the People's Bank of China and the China Securities Regulatory Commission announced an unusually aggressive and coordinated policy package, built around two facilities.
The first was a direct market backstop: a PBOC swap facility allowing brokers, funds, and insurers to pledge stock ETFs in exchange for high-grade liquid assets such as Treasury and central bank bills, widely interpreted as the central bank indirectly supporting the market.
The second was direct funding for buybacks, a re-lending facilitycreated specifically to fund company share buybacks and major shareholder purchases, which directly boosted demand for equities.
The effect showed up almost immediately. October 2024 marked the historic peak, with new account openings rocketing to 6.84 million in a single month, an increase of over 270% month over month and nearly 500% year over year, the highest monthly figure since the 2015 peak. By year end, total new accounts for 2024 reached 24.99 million, a 17% increase over 2023, pushing the total number of domestic equity investors past 320 million.
The surge proved durable rather than a one-off event. January 2025 saw 1.57 millionnew accounts despite the Lunar New Year holiday, still a healthy 1.30 million net of the holiday effect, and by March 2025 the pace had climbed again to over 3 million new accounts, with the "DeepSeek moment" providing an additional catalyst for investment in technology names. China Securities Depository and Clearing Corporation (CSDC) data confirms that 2025 was not merely a continuation of high participation but the single greatest year for retail investor growth in the history of China's capital markets.
Retail Capital Flow Dynamics in 2026
Several forces are now converging to sustain this participation into 2026.
Fixed deposit expirations: Roughly ¥50 trillion in long-term fixed deposits are set to mature over the course of the year, according to a Huatai Securities report, with the bulk concentrated in the first half.
Plunging bank yields: At the same time, households are abandoning traditional bank products as deposit rates slip well below 2%, a shift compounded by real estate's declining appeal as a wealth-building vehicle. Property's share of household assets fell to 52% in early 2026, pushing capital toward broader financial markets almost by necessity.
Rising equity market appetite: In what amounts to a familiar TINA (there is no alternative) dynamic, domestic investors have increasingly gravitated toward local equities. A surge in technology names pushed the Shanghai Composite to a ten-year high of 4,100 points earlier this year, triggering record single-session turnover of nearly ¥4 trillion. Further catalysts, including renewed enthusiasm around Kimi and FOMO-driven interest in CXMT, have helped sustain retail participation through 2Q26.
NBFI deposit inflow: PBOC data corroborates this enthusiasm directly. NBFI deposits grew by ¥4.65 trillion in 1H26 alone, a pace considerably faster than the ¥6.41 trillion added across all of FY2025, and well above the ¥2.55 trillion added in 1H25. Separately, mainland investors have been using the Southbound Connect scheme aggressively to buy Hong Kong-listed shares, pushing annual flows past US$120 billion for the first time, according to HSBC.
Institutional Participation
The retail account boom tells only half the story. Even as the number of retail accounts has exploded, institutional investors, measured by their share of freely tradable shares and trading volume, have steadily grown their influence as well. The market has become simultaneously more populated by retail participants and more dominated by institutional capital, a combination that matters for how the market is likely to behave going forward.
Official data compiled from the CSRC, PBOC, and exchange statistics confirms this trend. As CSRC Chairman Yi has stated: “In 2022, Professional institutional investors now hold 34% of A-share free-float market cap, up from 17% in early 2019.”
Chinese Equity Market Structure
It is worth remembering that large IPOs in Chinese equity markets have historically tended to be followed by selloffs, PetroChina's late 2007 listing and Guotai Haitong Securities' mid-2015 debut being the two most prominent examples. The underlying cause was largely structural: a nascent market, an outsized share of impatient retail and foreign investors, and a lack of stable domestic institutional capital to absorb volatility.
Much has changed since 2015. With real estate no longer the default vehicle for household wealth, retail investors have shifted more of their capital into stable fixed income and money market products in recent years, and in the process have grown noticeably less impatient than in the past. The idea of a "slow bull" market, gradual and durable rather than explosive and short-lived, has begun to take hold.
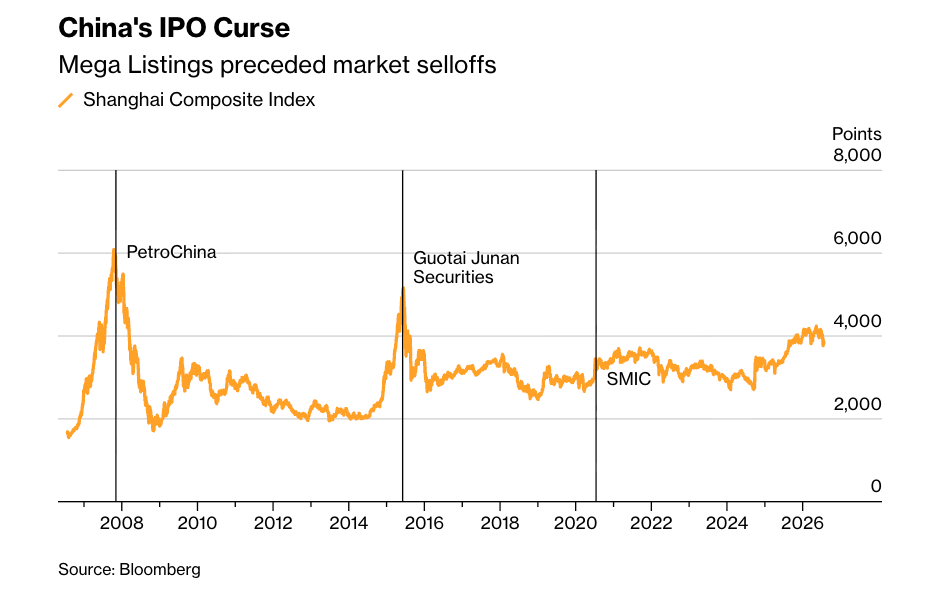
That shift has been reinforced by better investor understanding of financial markets and a regulator that has, on balance, become more focused on building durable market structure rather than experimenting reactively, as was more common in the past. It is true that the government has, at times, intervened forcefully to remove systemic risk from the still-developing capital market, and these interventions have frequently drawn criticism from Western media as heavy-handed. Having observed this development closely and worked within the system, we would offer a more measured read: these interventions tend to be applied with a genuine, if paternalistic, intent to protect ordinary investors from commercial actors seeking a quick and often exploitative profit, rather than to serve narrower political ends.
Growing participation from institutional investors and state-owned pension funds should support the market's longer-term stability, complemented by hedge funds that provide useful short-term liquidity. The recent turmoil in Korea's market is a useful reminder here: a resilient market structure takes years to build and can be undone very quickly.
By comparison, China's current trajectory looks considerably more sound, slow and cautious, but taking assertive steps forward rather than standing still.
Offshore RMB Development
A healthy offshore RMB market is critical to China's ongoing commercial trade relationships. As China has emerged as a dominant exporter of manufactured goods, industrial machinery, and precision components, and as it undertakes an increasing number of infrastructure projects across Global South economies, RMB funding has become correspondingly more important to how that trade actually gets financed.
The offshore RMB market has now been established and functioning for more than sixteen years, and over that time the ecosystem has matured considerably. A growing number of offshore investors are looking beyond traditional Chinese issuers, and that trend has picked up pace recently, aided by several converging macroeconomic and monetary policy shifts.
Drivers for Issuers
Lower cost of funding. The cost of funding has shifted meaningfully in RMB's favor. The Japanese yen served for years as the universal funding currency, thanks to historically low rates and a weakening currency, but that dynamic has largely run its course amid high inflation and currency volatility. U.S. dollar rates, meanwhile, have remained firm, with a steepening yield curve pushing up the cost of term funding. Chinese monetary policy, by contrast, remains on an easing path, making RMB funding costs considerably more palatable. Just as importantly, Chinese counterparties are increasingly willing to accept RMB as payment, since doing so removes currency risk on their side, while importers on the other end can hedge RMB exposure easily in a now-liquid offshore RMB FX market.
Geopolitical and currency diversification. Rising tensions have pushed multinationals toward a "China for China" strategy, funding their mainland operations in local currency rather than importing dollar funding. Separately, sovereign issuers including Hungary, Slovenia, Kazakhstan, and Egypt have turned to RMB issuance both to diversify away from dollar-denominated debt and to deepen ties through the Belt and Road Initiative.
Regulatory changes have removed much of the remaining friction. Chinese regulators have significantly eased capital controls on bond proceeds, giving issuers far greater flexibility to either deploy raised RMB domestically or repatriate funds offshore for global use as needed.
Offshore Bond Market Evolution
The offshore RMB bond market has been transforming steadily over the past five years, and the pace of that transformation is accelerating. Foreign issuance in the Dim Sum bond market has grown rapidly, with first-quarter 2026 issuance surging 128.6% year on year to CNY 76.8 billion, a clear signal that foreign issuers are no longer treating RMB funding as a niche alternative.
Summary
Consumers are in good shape. Household financial positions remain strong, with substantial savings providing a real buffer against any downturn. Manufacturing and industry are performing well, jobs remain available, and the new economy- foundries, data centers, frontier AI models, and broad enterprise adoption- is driving genuine infrastructure investment. On top of this, the government has moved to deliver on one of its core Five-Year Plan commitments through a strategic initiative aimed squarely at boosting consumer spending.
Industry and manufacturing remain a genuine strength. China holds a leadership position in 66 of 74 sectors tracked for innovation and technology. Chinese factory pricing remains attractive to the Global South and to any buyer prioritizing cost, and we view global factory price convergence, including AI hardware and semiconductors, as a secular trend likely to play out over the next two decades. That said, this trend is not without risk of disruption from incumbents, and it is one we continue to watch closely. Export demand remains strong and should continue to grow, while import growth, though still positive, has slowed sequentially.
The capital market is developing on two fronts.
On the debt side, we see:
A strong underpinning supporting rising issuance of RMB corporate bonds by non-Chinese companies.
Improving liquidity and ecosystem
RMB's growing role as a genuine trade currency rather than a purely domestic one.
On the equity side, we view 2025 as a historic anomaly, the product of a perfect storm combining policy shock, a compelling technology narrative, and no small amount of FOMO. We see 2026 differently: not a reversion to the old normal, but a settling into a new, higher equilibrium, one defined less by speculative frenzy and more by a sober, structurally driven market with real depth and diversity, both in the companies available and in the types of investors participating, guided by the paternalistic but generally sensible instincts of Chinese regulators.
The engine is still running. The turbochargers, for now, have simply been switched off.
We remain constructive on this development and would continue to add to our positions, with appropriate vigilance.
Europe Outlook
European politics are messy
France — the biggest political risk, but growth-neutral so far. Its political instability is real and structural: five PMs since 2022, a hung parliament, no majority for a restrictive budget, and multiple sovereign credit downgrades (Fitch, DBRS, and KBRA all cut France's rating over the past year) on fiscal-paralysis grounds. Marine Le Pen's appeal trial concluded in the spring, with a verdict on her eligibility for the 2027 presidential race expected before the end of summer; her original conviction carries a five-year ban from public office. The IMF and INSEE both cut France's 2026 GDP growth forecast to 0.7% (from 0.9%) as of May/June 2026, citing the energy-price shock from the Iran conflict; the Banque de France's own baseline is more cautious still, at 0.5%. On the fiscal side, the government has already implemented €6 billion in emergency savings, with a further €3 billion in cuts or freezes under discussion to offset unplanned spending. Public debt, at roughly 115-116% of GDP currently, is set to approach 120% by 2027 — a genuine vulnerability.
Germany — economically stagnant but showing tentative signs of bottoming, and politically calmer than France. Growth forecasts for 2026 cluster around 0.6-0.8% (European Commission: 0.6%; Bundesbank: 0.6%; ifo Institute: 0.8% as of mid-June), a far cry from the more optimistic 1.3% pencilled in before the Iran conflict. Chancellor Merz's coalition has been negotiating a broader package of tax, labour, and pension reforms through the second quarter, building on an earlier pension package passed by parliament; talks were described as "constructive" heading into the summer, though the more sweeping reform agenda remained unresolved as of end-June. Structural drags persist — Chinese competition, an aging workforce, a weak auto sector — but the government is leaning into fiscal expansion (including a €500 billion infrastructure and climate fund) rather than austerity.
UK — political risk is elevated, and growth has been downgraded. The Office for Budget Responsibility cut its 2026 GDP growth forecast from 1.4% to 1.1% in its March 2026 Economic and Fiscal Outlook, reflecting weaker-than-anticipated data, higher unemployment, and subdued business sentiment — a forecast finalised before the Hormuz-driven energy shock, which the OBR itself flagged could have further significant impact. Near term, the UK's main risk is political instability at the top of government.
Spain — the strongest of the large economies. Realised year-on-year growth reached 2.7% in Q1 2026, roughly triple the eurozone average, though full-year 2026 forecasts have been trimmed since the Iran conflict began — CaixaBank Research revised its call down to 2.1% (from 2.4%) in June, and the European Commission's own forecast sits at a similar level. Spain's direct trade exposure to the Gulf is limited (just 0.5% of GDP), which has helped insulate it relative to peers.
Italy — a rare period of political stability, but the weakest growth among the majors. The European Commission, OECD, and Bank of Italy all put 2026 growth at around 0.5%, weighed down by high debt-service costs and a public debt ratio still rising toward 140% of GDP by 2027.
Poland — the standout growth story. The European Commission projects 3.5% growth in 2026, driven by resilient private consumption and a high level of EU-funded investment — a rate matched only by Malta among EU economies.
Netherlands — solid but slowing. Growth is projected to ease to 1.3% in 2026 (from 1.7% in 2025), per the European Commission, ING, and Rabobank, as export momentum fades and private investment stays subdued.
Yet Europe's stock markets are not its economy.
It's true that Europe's growth outlook lags: euro area GDP growth for 2026 sits around 0.9-1.1% on most current forecasts, versus considerably stronger readings for the US. The region also seems ill-equipped for the 21st century: it has neither the AI giants to compete with the US and China, nor sufficient data centers, and its electricity grid is strained even without the added burden of data center demand. Its power supply is a vulnerability given that the EU imports roughly 57% of its energy needs (Eurostat) and European natural gas costs nearly 4 times more than the US natural gas. European electricity tariffs average at US$ 0.25~0.33 per kWh vs US$ 0.16~0.20 in the US and US$ 0.07~0.09 in China.
Additionally, driven by the intricate landscape of political dynamics and labor unions, equity markets have performed robustly based on the assumption of discounted valuations. This rally largely overlooks the reality that, on an industry-matched basis, the index exhibits lower multiples historically due to a heavier concentration of financial, industrial goods and services, and pharmaceutical firms relative to technology.
Notwithstanding these structural challenges, the STOXX Europe 600 staged a historic rally, climbing roughly 21% over the past year and hovering near record highs through 31 Jul 26. This surge materialised alongside a modest 11% trailing twelve-month (TTM) EPS expansion. By comparison, the S&P 500 gained 20% over the identical timeframe, underpinned by TTM EPS growth that surpassed 20%, even before accounting for its exceptional 2Q26 EPS increase of over 47% to date.
Although Europe's market outpaced the S&P 500 during this period, its trailing P/E multiple rerated from 17.4x in Jan 25 to 19.6x as of 31 Jul 26. Consequently, European equities can no longer be considered cheap, given that the S&P 500 trailing P/E coincidentally sits at the exact same level of 19.6x.
For Europe to continue delivering performance, it will not be from valuation expansion, but earnings growth. The street expectation of Europe growing EPS by 18% after only achieving 11% seems challenging in the face of various headwinds while the US and China have structural tailwinds.
Furthermore, allocating capital to Europe has become exceptionally difficult and nuanced. This is because European corporations are failing to deliver products that are either more cost-effective and superior to those from China or more innovative than those from the US, particularly as China takes the lead in robotics, engineering components, automobile, and material science—sectors historically dominated by Europe—while the US maintains its vanguard status in semiconductors, AI, IT technology, and biotech. Compounding these structural challenges, European firms are expected to remain subservient to US export restrictions targeting China, which represents their largest customer base.
So, should we avoid investing in Europe?
Ironically, the closure of the Strait of Hormuz has actually benefited some European firms: chemicals producers including BASF and Evonik saw a genuine profit tailwind in Q1/Q2 2026 as customers rushed to restock ahead of feared shortages, and the broader energy complex saw a similar lift.
On the flip side, this margin expansion comes at the expense of downstream agricultural and manufacturing sectors within Europe. Consequently, their offerings face a competitive disadvantage against Asian rivals, with the notable exception of wine, champagne producers and watchmakers and fashion houses who retain robust pricing leverage.
Europe must decide what is their future strategy. We need Europe to have a clear direction that is achievable, pragmatic and realistic than just announcement and more talks.
Bottom Line: Europe needs structural change
A rigorous macro assessment underscores that future prospects for Europe face formidable headwinds, including economic stagnation, political instability, monetary policy approaches, a lack of technological leadership, constrained fiscal capacity, and eroded pricing power. Consequently, profound structural changes and substantial reform remain imperative before European large caps or startups can satisfy our strict investment criteria. Europe stands at a crossroads, forced to decide between increasing idealism or greater pragmatism. This challenging landscape is vividly illustrated in the automotive sector: despite achieving global scale and demonstrating a resolute commitment to the green transition and electric vehicles, ventures such as Northvolt and Morrow have succumbed to bankruptcy. These failures materialized despite substantial backing from industry champions like VW, BMW, and Mercedes—which have themselves experienced declining sales and stock prices.
Appendix I - US Economic Data Analysis
The overall picture is one of stability with slight cracks beneath the surface.
By Joshua Dass
Employment
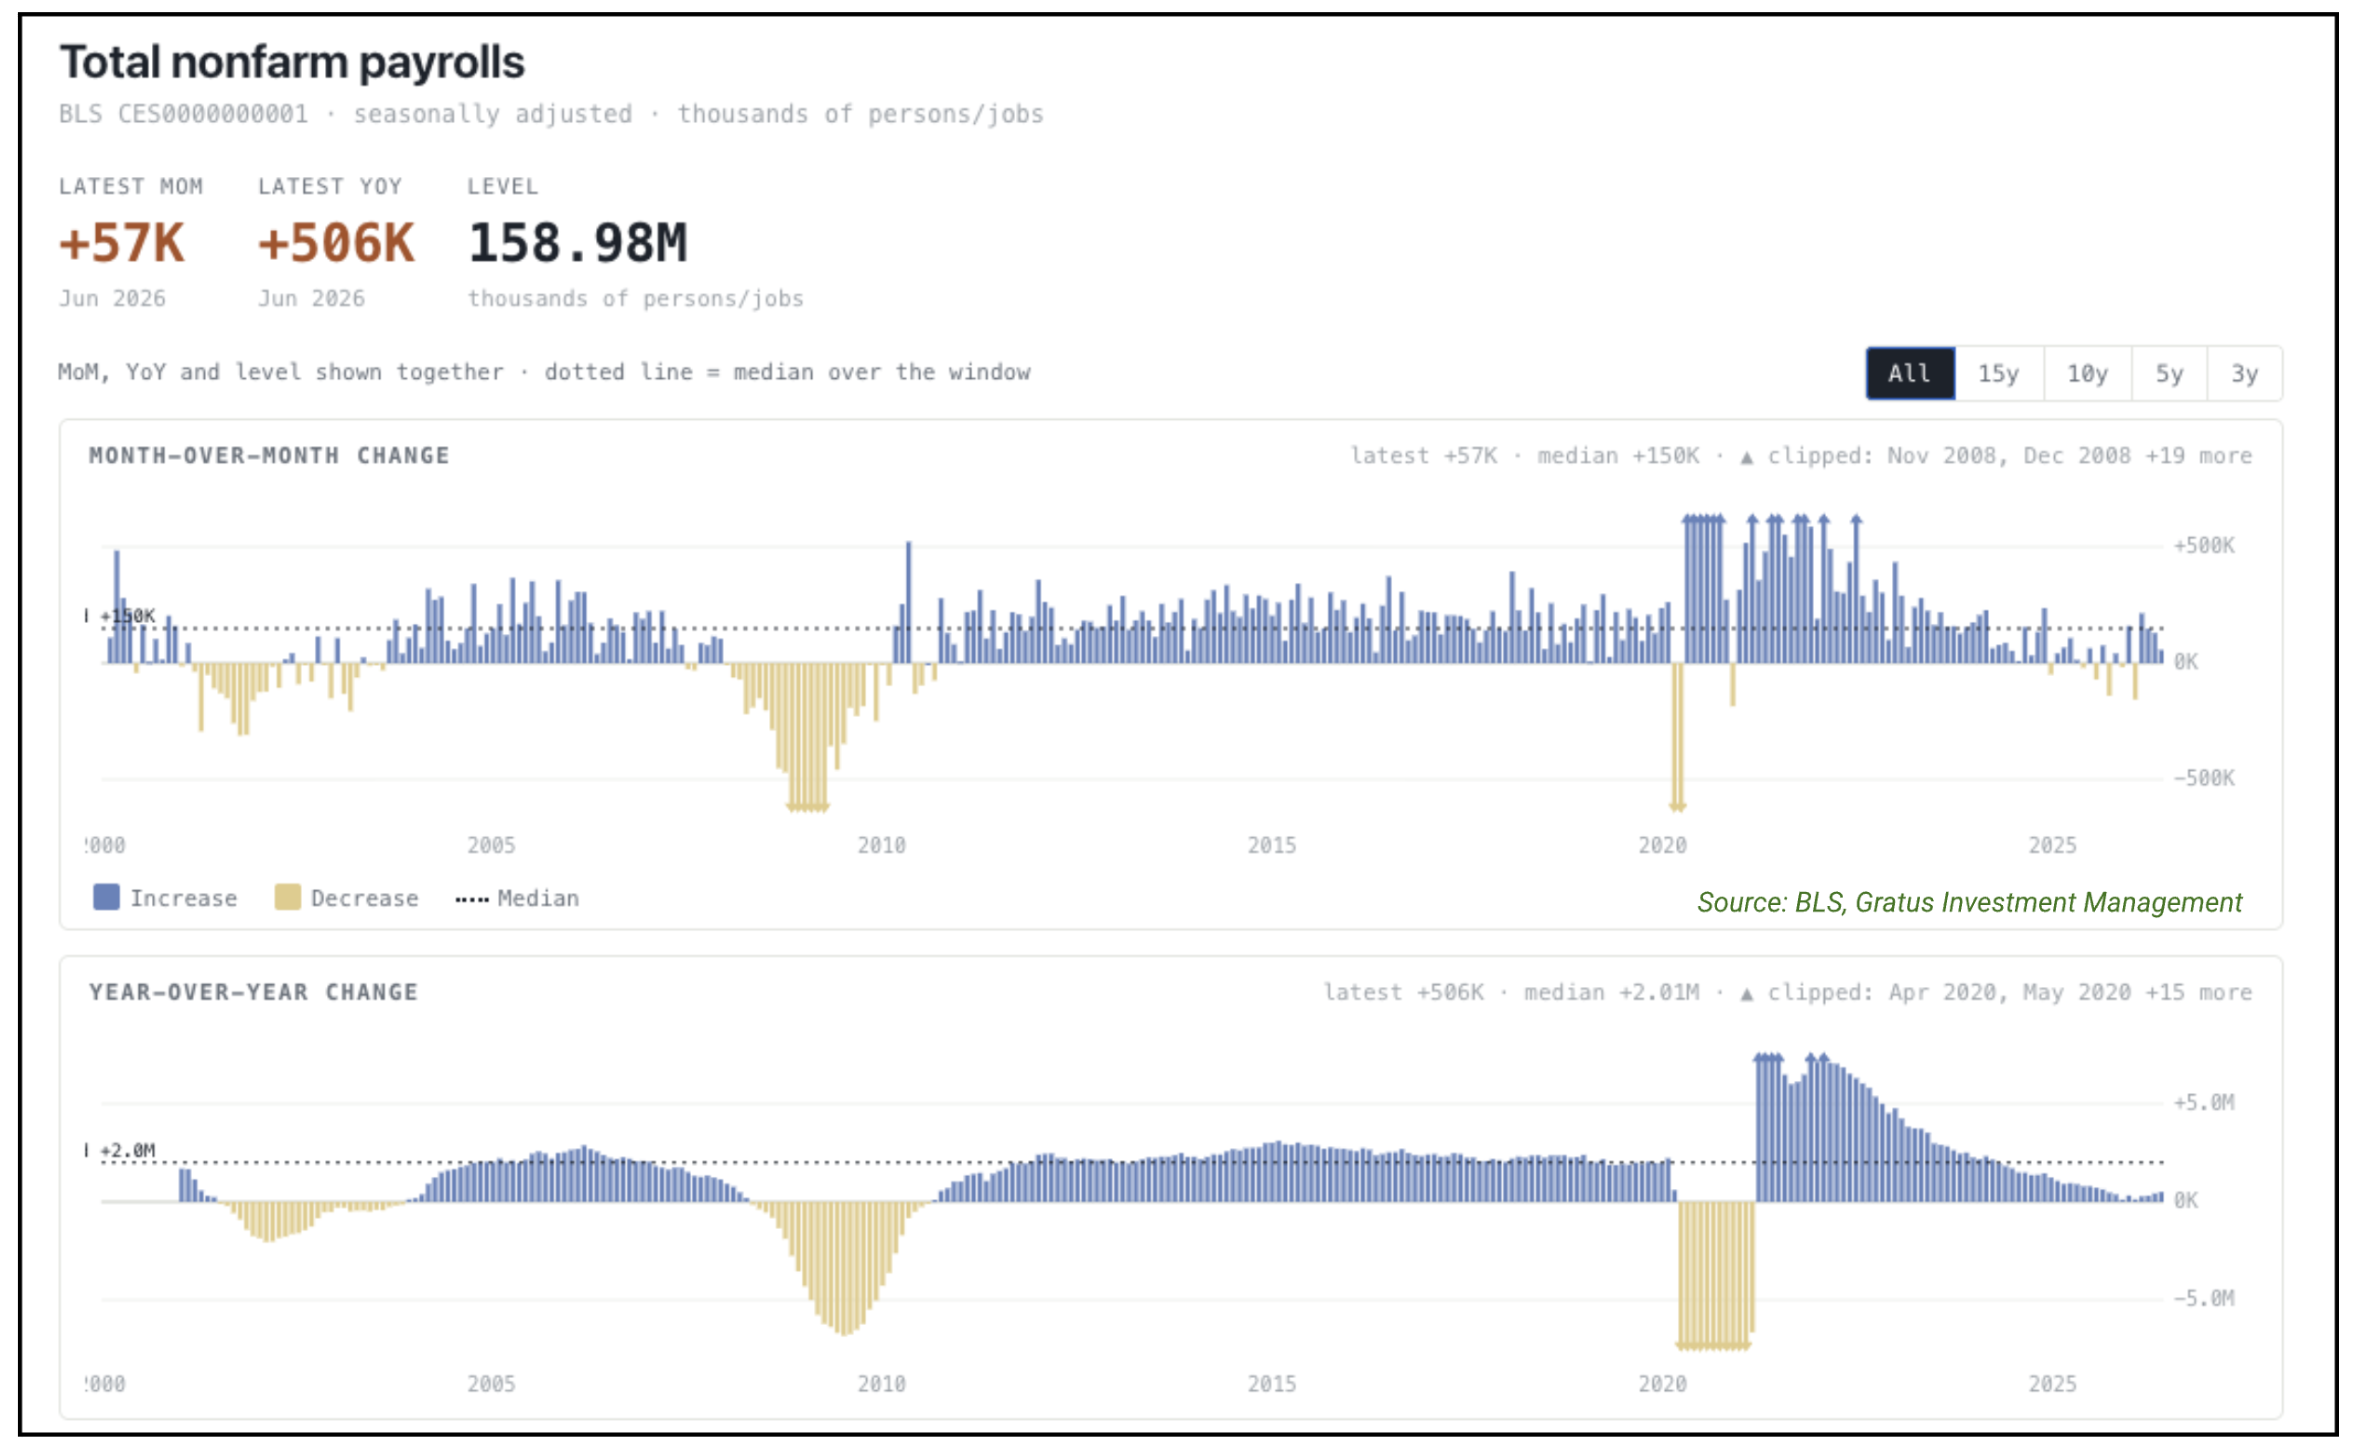
Employment is stabilizing, not deteriorating. 2024 and 2025 were a straight line in the wrong direction: payrolls slowed to a low of 116K by December 2025, and unemployment climbed to 4.5%. In 2026 that's reversed — NFP, unemployment (now 4.2%), JOLTs, and ADP have all turned together from deteriorating to flat-to-improving. June's headline print was ugly (57K, underlying growth closer to 47K after backing out a modest World Cup boost), but one soft month inside an improving trend isn't a trend change. The caveat: the ruler itself is shrinking. CES survey response rates have fallen from ~60% pre-COVID to the low 40s%, forcing BLS to lean more on statistical estimation, and revisions have run negative for three straight years. We hold this conclusion a bit more loosely than the headline numbers alone would suggest.
Inflation
Inflation is high, but the driver is fading in early July. Headline was running hot through May (CPI 4.2%, PCE 4.07%), and the culprit was identifiable rather than broad: energy, up 23% YoY on the Iran conflict. ICE Brent Crude has already round-tripped from $126 (30 Apr 26) back to $70 (2 Jul 26) — roughly pre-war levels — and we expected that disinflationary pass-through to start showing up in the data. It did: June CPI fell 0.4% month-over-month, the sharpest one-month drop since COVID in Apr 2020, driven by a 5.7% monthly decline in energy prices. Core inflation — which strips out food and energy — came in flat at 0.0% for the month. Headline YoY eased to 3.5% from 4.2%; core YoY eased to 2.6% from 2.9%. That's the thesis playing out in real time: as the energy shock rolls off, the headline number is converging back toward the calmer, more representative core reading.
But this has been upset by the new developments in mid-July when the Iran war escalated, with Houthis disrupting the remaining Red Sea flow. Since the start of the Iran war in March, the volume has surged from the historical average of ~4.5 million barrels to ~7.4 million barrels a day in mid 2026, accounting for 7% of global supply.
The chart above highlights two of the pertinent factors driving inflation: rent and energy costs. Rent is 35% of CPI, and energy ex electricity weight in CPI is 4.55%.
With over a 40% increase in diesel and gasoline prices, the impact on fuel prices can be detrimental.
This makes looking through the current lens murky. Energy prices are very volatile, and the course can reverse overnight with changes in ME. On the domestic front, the US has levers to pull given they are a net exporter of crude and refined products (11%-13% of global demand and more than half of OPEC 12). Europe and Asia will be more affected.
Shelter and food stayed subdued, reinforcing that the disinflation is broad rather than a one-category fluke. Rental prices have been subdued in recent months according to the Zillow Observed Rent Index. Given that it is a significant component of the CPI worth 35%, the continued weakness will offset the elevated energy cost. Services inflation has also been soft, due to softening motor insurance premiums and automobile sales, new and used.
Some may worry about the severe El Niño forecasted this year. However, this does not affect US food costs given that the US is a net exporter of agricultural produce, and the weather system does not affect its planting season.
El Niño has more impact on Southeast Asia, Australia, and South America's food production, and the higher agricultural prices benefit US exporters.
This development is positive for the US federal government revenue. Windfall tax collections from major commodity companies in both the food and energy sectors will be substantially higher than usual.
Wages
Wages — real deterioration, but overstated by an energy-driven distortion. Nominal wage growth is genuinely solid and broad-based: the Employment Cost Index is up 3.3%, Average Hourly Earnings up 3.5% — two independently built series landing within 0.2 points of each other. The trouble shows up once you deflate. Against headline CPI, real wage growth comes in at –0.9%; against core CPI, +0.4%. Most of that gap is the Iran-war energy shock sitting inside headline CPI, and as oil unwinds from its $126 peak back to $70 today, we'd expect the headline read to converge back toward the core.
Real wages have been trending down for several months now, not just in the latest print, and a second, independent series corroborates it: real personal income growth (YoY) has been running below real PCE growth (YoY) for a sustained stretch, not a single blip — consumption outpacing income growth, which is the arithmetic behind the savings rate's slide to 3.0%, a four-year low. That's a genuine trend, even if part of its magnitude is a temporary artifact of the energy shock.
Household Wealth
Household wealth — record wealth, concentrated and fragile. The top 0.01% hold 14.4% of all household wealth against just 1.2% of liabilities; the bottom half holds 2.5% of wealth against 30.4% of liabilities. Only 63% of adults can cover a $400 emergency expense — flat since 2022, worse than 2021 — and just 55% have three months of expenses saved. More relevant for us as investors: that wealth is unusually concentrated in stocks, and those stocks are unusually concentrated in a handful of names. Equities are 45-47% of household financial assets, roughly triple the 2008 share, and 401(k) equity allocations sit near 70%, the highest in 75 years. The Shiller CAPE is at 39.5 — 2nd only to the December 1999 peak — with the seven largest tech names driving ~41% of last year's S&P gains. The household balance sheet is being carried by a narrow, richly-priced rally. Fine, as long as the rally holds. Not fine the moment it doesn't.
In summary: the macro aggregates look calm mostly because one force — with some impact from heightened energy price but not as detrimental as 1970s as US is now a total petroleum exporter with a 11%-13% global share and over 60% of OPEC production level, has more levels to pull than other net importers.
What that calm doesn't show is a widening split beneath the surface, between households with a cushion and households without one. Stable, for now. How long "stable" holds depends on whether that split stays contained.
Appendix II Fall in the Participation Rate
By Joshua Dass
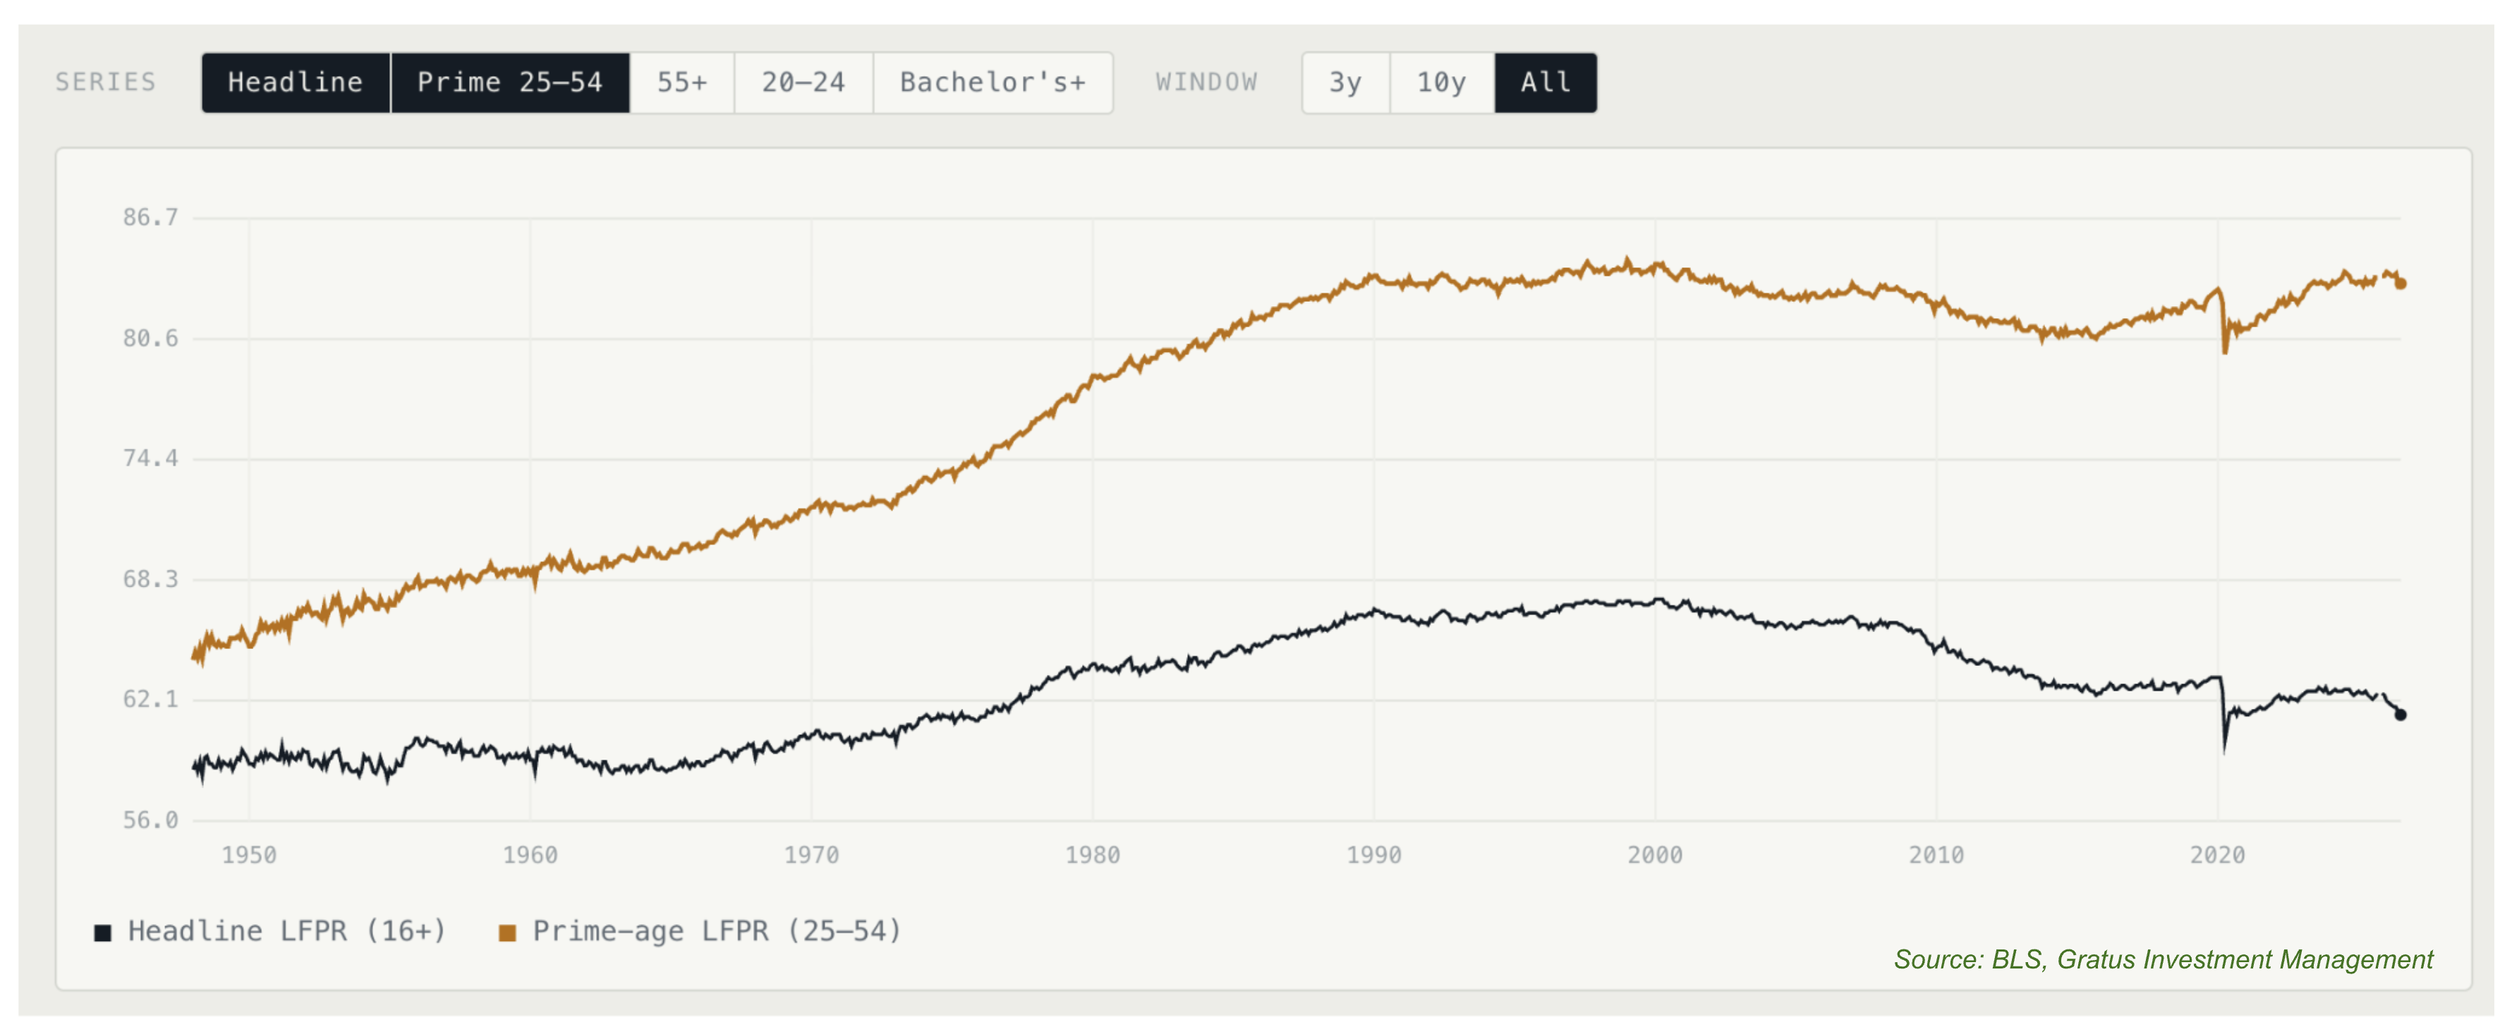
There was a sharp fall in the labor participation rate in June. Was the drop unusual, or normal noise?
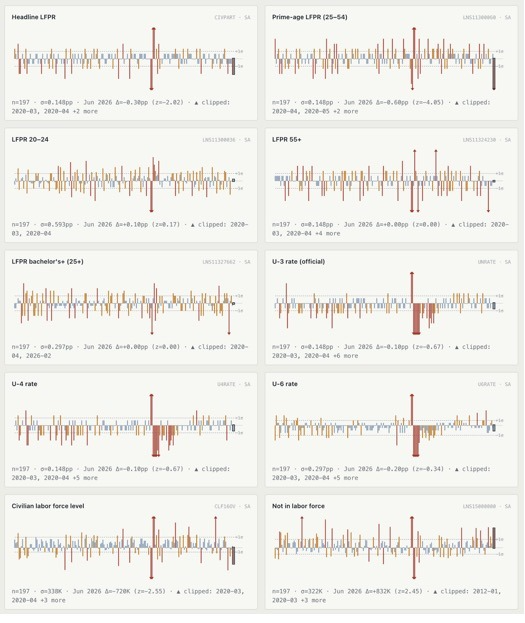
Every economic series bounces around from month to month for reasons that have nothing to do with the underlying economy, sampling noise in the household survey, rounding, seasonal-adjustment quirks. So the first question to ask about any "big move" is: how big is big, relative to how much this series normally jumps around? That's what a z-score gives you, the move divided by the series' own historical standard deviation.
Headline labor force participation (LFPR) fell 0.3 percentage points in June. Its typical month-to-month standard deviation is about 0.21–0.24pp, so a 0.3pp move works out to roughly 1.2–1.4 standard deviations, the kind of move that happens something like one month in eight to thirteen. Notable, but well within "this happens all the time" territory.
Prime-age LFPR (25–54) told a different story. It fell 0.6pp in the same month, against a typical monthly swing of similar size to the headline series, around 0.21–0.27pp. Because the move itself was roughly twice as large, it works out to a z-score of -4.05. Moves of that size are genuinely rare, on the order of a handful of months out of the last several hundred.
So the headline number, the one that "felt like" the anomaly, is actually the less surprising figure statistically. The real outlier is hiding in the age composition: prime-age workers, the group with the least demographic noise (no retirements, no school enrollment swings clouding the picture), had an unusually bad month.
Why the age cut matters
Prime-age LFPR is the cleanest gauge economists use precisely because it strips out the two biggest "healthy" reasons participation drifts around: kids aging into school and college (the 20–24 cohort) and boomers retiring (55+). If prime-age workers are suddenly leaving the labor force, that's a materially more legitimate worry than the headline moving on its own, since the headline drifts for demographic reasons constantly. Consistent with that read, the 55+ participation rate was exactly flat, 37.1% to 37.1%, and the other age cuts showed no comparable stress. Whatever happened in June was concentrated almost entirely in the prime-age bracket.
Demand shock or supply shock?
A drop in participation could mean people are losing jobs and giving up the search (a demand problem), or it could mean people are simply no longer available to work (a supply problem). Two pieces of evidence point toward supply.
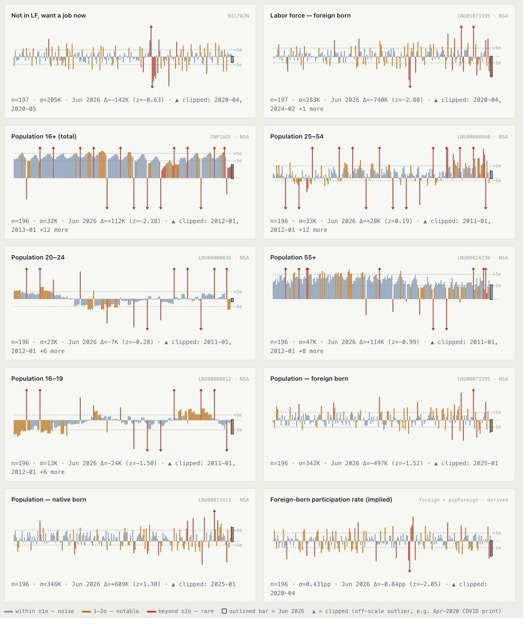
First, where the missing people came from. The civilian labor force fell 720K, and separately, the "not in labor force" count rose 832K. These two figures aren't in conflict; they're linked by the roughly 112K of population growth that occurs every month as people turn 16 or enter the country; if none of that growth is absorbed into the labor force, "not in labor force" rises by more than the labor force itself falls.
What stands out is that the total labor force falling by 720k is almost exactly that same amount — 740K — as the fall in the foreign-born labor force count. That's a strong signal the decline is concentrated in one group rather than spread broadly across the workforce the way a demand-driven layoff wave typically would be.
Second, the "worry" indicators moved the wrong way for a demand story. If this were people losing jobs or growing discouraged, you'd expect unemployment and discouraged-worker measures to rise alongside the participation drop. Instead, U-3, U-4, and U-6 all ticked down.
U-6, the broadest underemployment measure, fell from 8.1% to 7.9% (-0.2pp);
U-4, which includes discouraged workers, fell from 4.6% to 4.5% (-0.1pp);
U-3 also edged down (-0.1pp).
Separately, the number of people "not in the labor force but who want a job" fell by 142K.
None of these individual moves is statistically significant on its own, but directionally, all of them point the same way: away from a layoff story. People aren't swelling the ranks of the discouraged; they're leaving the labor force count and not looking, consistent with exit rather than displacement.
Testing the leading explanations
We checked the candidate explanations against the data. Most didn't hold up.
Early retirement is ruled out. Retirement flows would show up in the 55+ participation rate, which was unchanged. The anomaly is specific to the 25–54 bracket, which retirement doesn't explain.
Voluntary job-hopping or confident departures is also ruled out. JOLTS quits sat at 1.9% in the most recent reading, in line with historical norms and well below the 2022 "Great Resignation" peak. There's no sign of an unusual wave of people confidently walking away from stable jobs.
Entrepreneurial or project-based exits is mechanically plausible but unconfirmed. CPS only counts someone as employed if they did work for pay or profit during the survey week, so a founder in a pre-revenue, pre-launch phase who isn't simultaneously job-hunting would correctly be classified as not in the labor force. Business formation data has shown elevated application activity for months, which fits. But prime-age LFPR held flat for eight straight months, September 2025 through May 2026, before breaking suddenly in June, and a slow-building structural trend should produce gradual drift, not a flat line followed by a cliff, unless something specific to June triggered it.
"AI-driven voluntary exits" is unsupported. It's a narrative, not something any series in this dataset can confirm or deny.
Where this leaves us
There is no single confirmed driver, but the evidence, taken together, points more toward a supply-side story than a demand-side one, and the foreign-born concentration is the most concrete lead so far. In rough order of current evidentiary weight:
Statistical noise or a classification/composition effect, plausibly the foreign-born concentration itself, whether through emigration, status changes, or reduced survey coverage of that population, possibly compounded by seasonal-adjustment distortion around the World Cup's timing in June. This is currently the best-supported explanation, largely by elimination of the alternatives, though "best-supported by elimination" is a modest bar.
Genuine labor-market softening, voluntary or involuntary exits tied to a weakening economy, though the standard corroborating signals, U-3, U-4, U-6, and discouraged-worker counts, haven't moved enough to confirm this independently. If anything, they moved the opposite direction.
A structural shift toward project-based and entrepreneurial work, mechanically consistent with how CPS measures employment and supported by a real, if imperfectly sourced, business-formation trend, but not yet reconciled with the specific timing of June's break.
A single -0.6pp print in a series with this much month-to-month noise carries a real chance of partially reversing next month. We'd treat this as "flag it, watch July" rather than "the labor market just cracked." A retracement back toward trend would support explanation (1); further deterioration in U-3/4/6 alongside continued LFPR weakness would support (2); and a visible spike in Census business-formation data specifically timed into June, alongside continued calm unemployment readings, would strengthen (3). Worth checking the World Cup's specific timing against your JOLTS and NFP seasonal-adjustment work as well, since a large one-off event concentrated in June could distort the adjustment factors in exactly the way that would produce an isolated bad print with contradicting internals.
Source: BLS, Gratus Investment Management
Source: BLS, Gratus Investment Management
Disclaimers:
This article expresses the author's views as of the date indicated on the publication and such views are subject to change without notice. Gratus has no duty or obligation to update the information contained herein. Certain statements contained herein constitute forward-looking statements, which are subject to known and unknown risks, uncertainties, and assumptions. Actual events or results may differ materially from those reflected or contemplated in such forward-looking statements. Further, Gratus makes no representation, and past investment performance should not be assumed to indicate future results. Moreover, wherever there is a potential for profits, there is also the possibility of loss. This publication is made available for educational purposes only and should not be used for any other purpose. The information contained herein does not constitute and should not be construed as an offering of advisory services, a recommendation to buy or sell any securities or related financial instruments in any jurisdiction. Any reference to specific companies or securities is for illustrative purposes only and may not represent actual holdings of any Gratus’ portfolio. Certain information contained herein concerning economic trends and performances is based on or derived from information provided by independent third-party sources. Gratus Investment Management Private Limited (“Gratus”) believes that the sources from which such information has been obtained are reliable. However, it cannot guarantee the accuracy of such information and has not independently verified the accuracy or completeness of such information or the assumption on which such information is based. This publication, including the information contained herein, may not be copied, reproduced, republished or posted in whole or in part in any form without the prior written consent of Gratus. Accordingly, neither we nor any of our associates, directors, connected parties and/or employees accept any liability whatsoever for any loss, whether direct or indirect, that may arise from the use of information or opinions provided.
Related Insights